R로 시계열 데이터 다루기
Harrison Brown
Graduate Researcher in Geography
zoo::roll*:
zoo::roll*
rollmean()
rollmax()
rollsum()
제한사항:
rollmin()
rollapply(data = ftse,
          width = 7,
          FUN = min,
          align = 'right',
          fill = NA)
인수:
data
width
k
FUN
mean
max
align
'left'
'right'
'center'
fill
목표:
daily_temp
2019-01-01 13.191304
2019-01-02  6.945833
2019-01-03  8.495833
2019-01-04  8.683333
2019-01-05  7.400000
...
find_range <- function(x){
  max(x) - min(x)
}
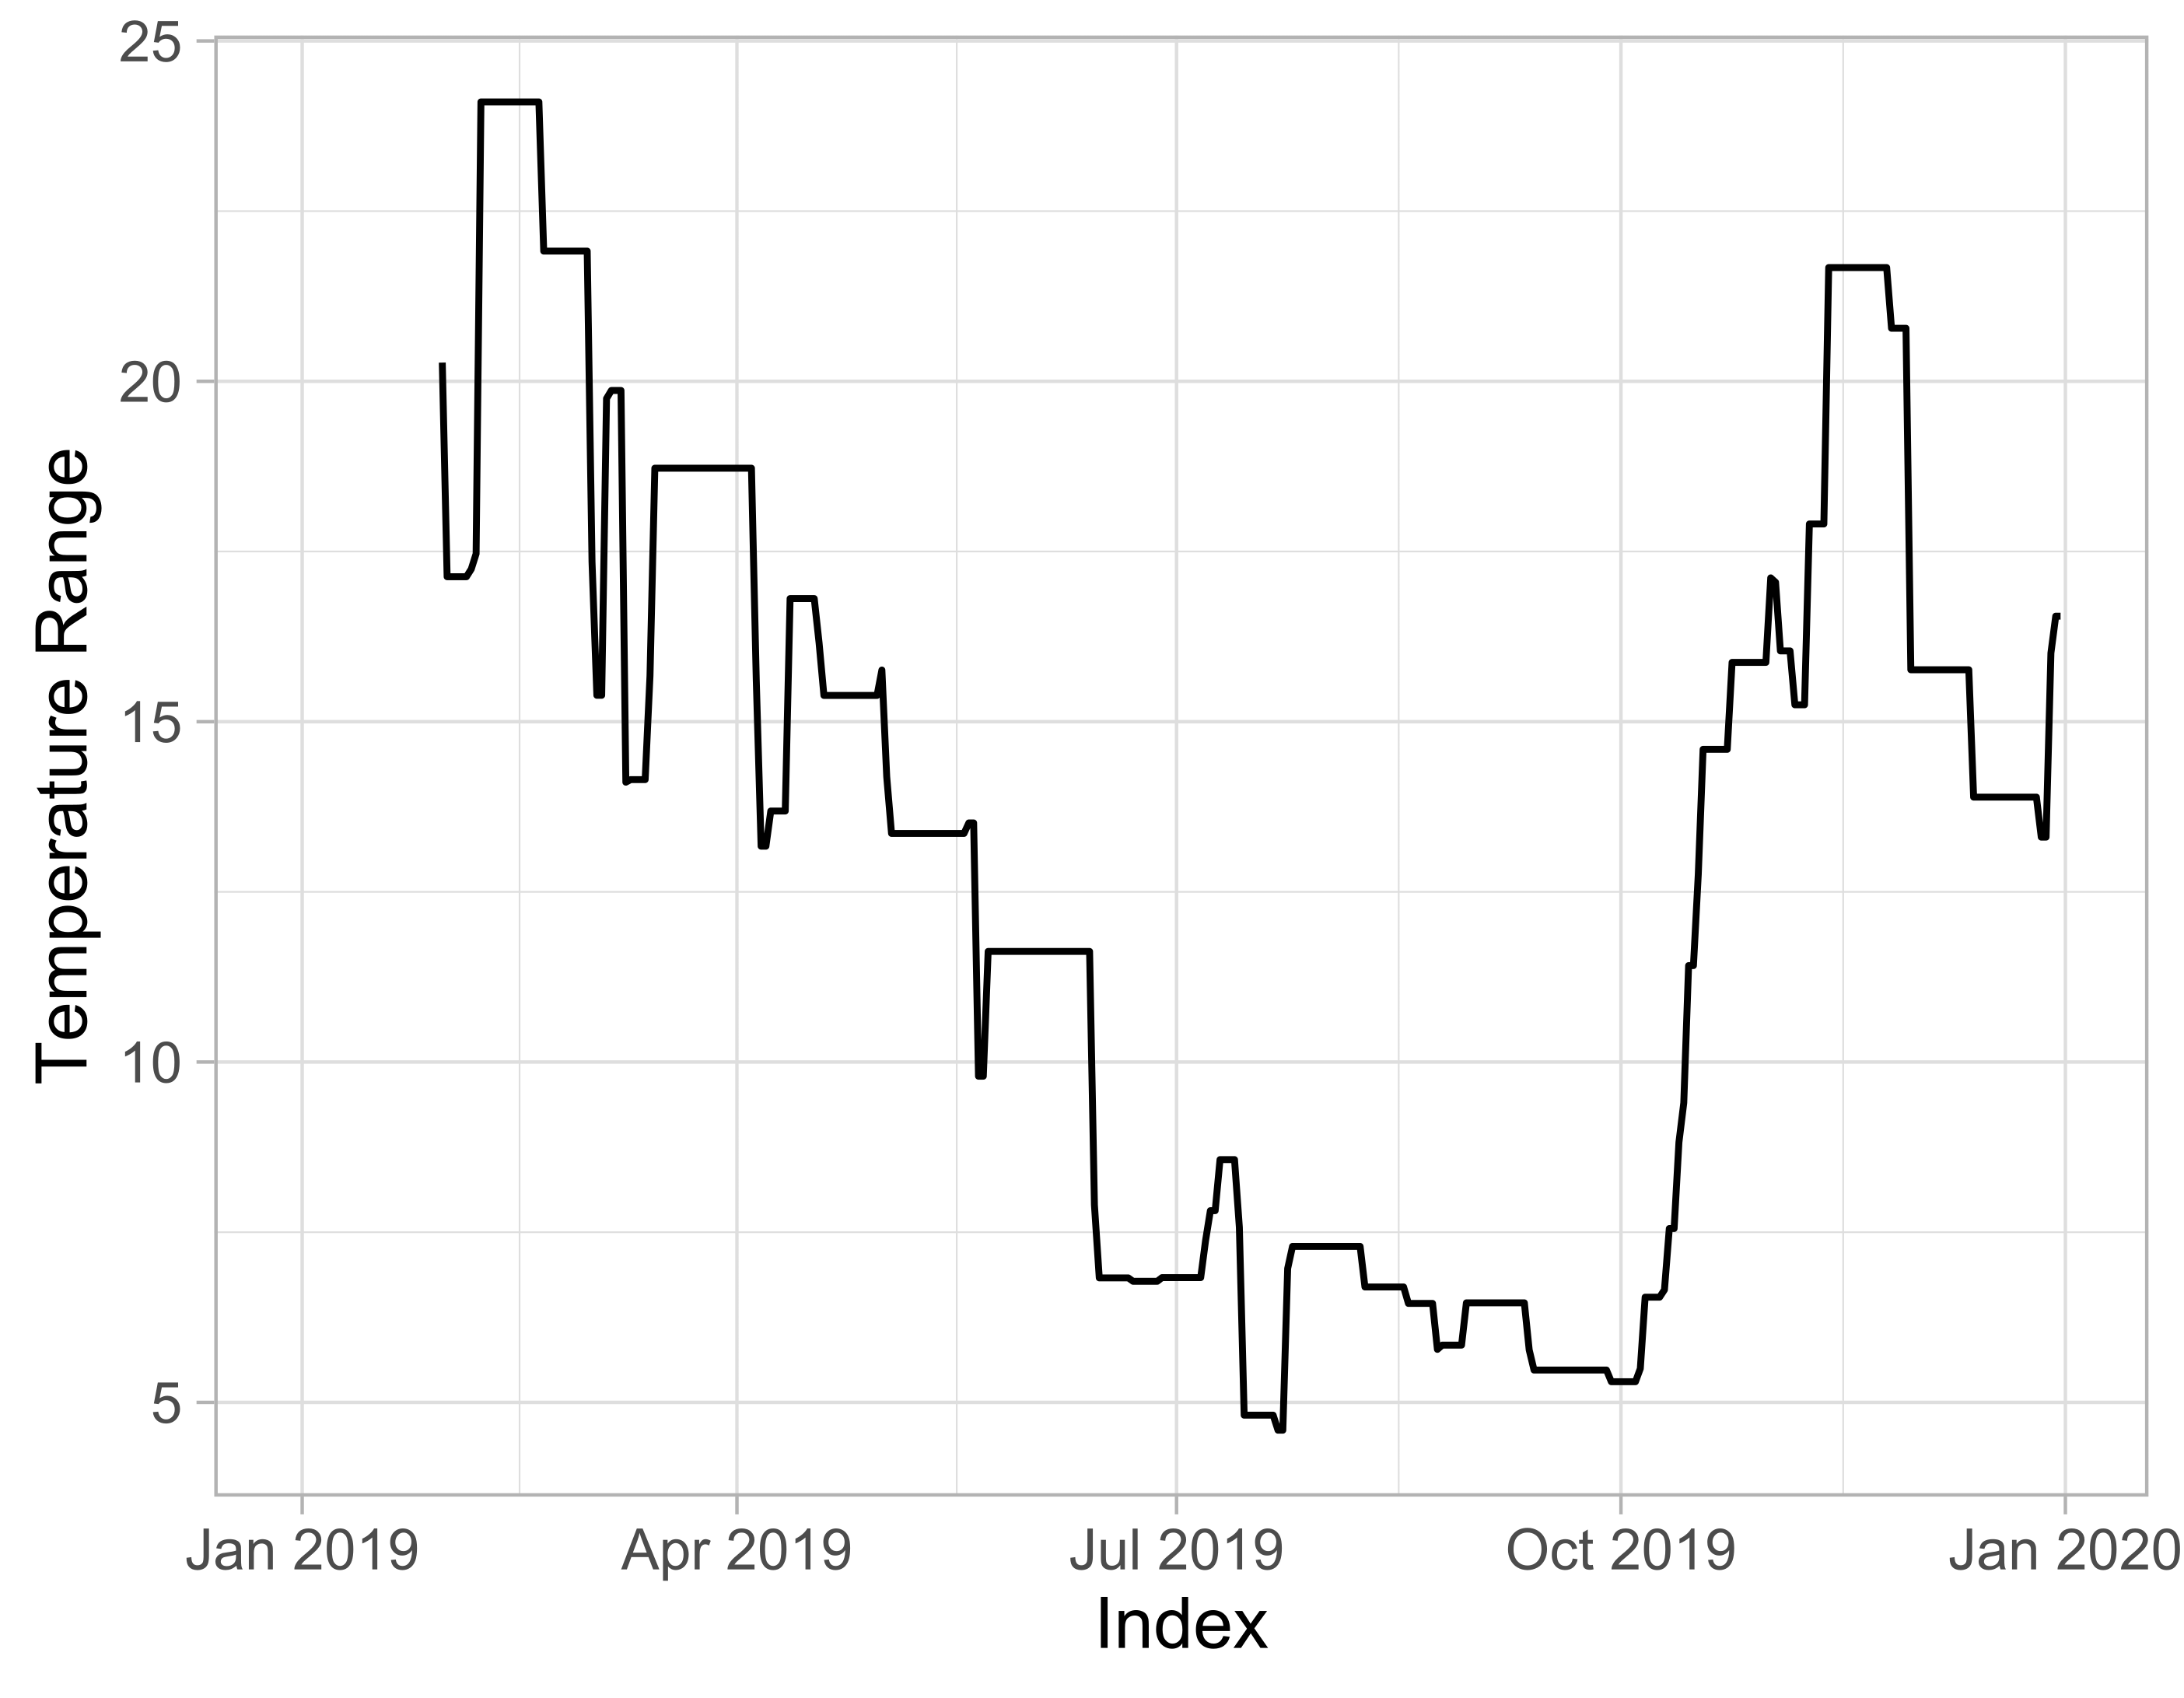
daily_temp_range <-
  rollapply(
      daily_temp,
    FUN = find_range,
    width = 30,
    align = 'right',
    fill = NA
  )
autoplot(daily_temp_range) +
  theme_light() +
  labs(y = 'Temperature Range')