비율 지표와 델타 방법

Python으로 배우는 A/B Testing

Moe Lotfy, PhD

Principal Data Science Manager

비율 지표 A/B 테스트

  • 평균 지표

평균 지표 예: 평균 주문 금액과 페이지 체류 시간

  • 분석 단위:

    • A/B 테스트에서 분석되는 개체
    • 비율 지표의 분모
  • 무작위 배정 단위:

    • 각 변형에 무작위로 배정되는 대상
Python으로 배우는 A/B Testing

비율 지표 A/B 테스트

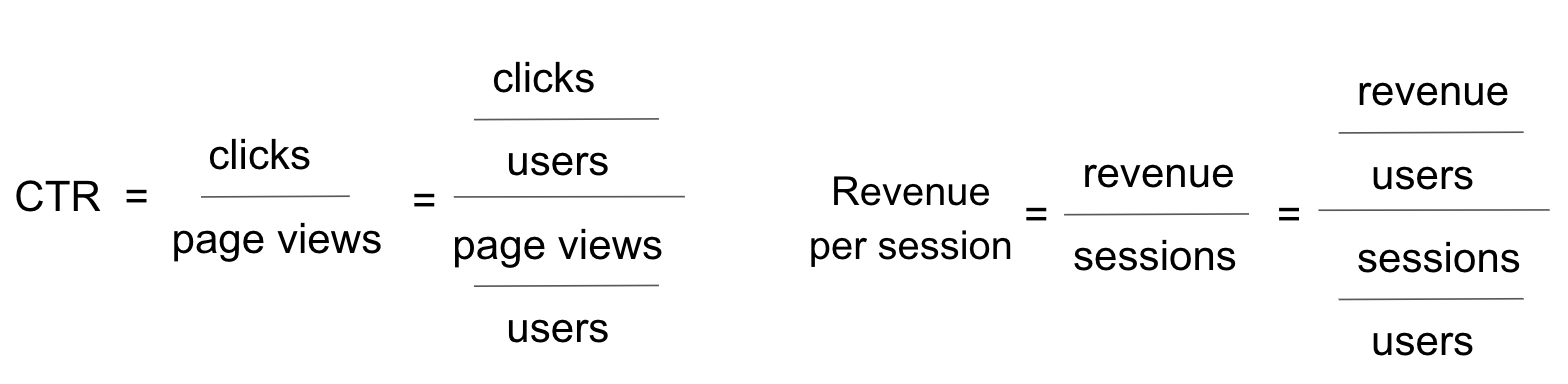
  • 사용자 기준 비율 지표

비율 지표 예: 클릭률과 세션당 매출

Python으로 배우는 A/B Testing

델타 방법 도입 배경

print(checkout.groupby('checkout_page')[['order_value','purchased']].agg({'sum','count','mean'}))
              order_value                     purchased              
                     mean           sum count      mean     sum count
checkout_page                                                        
A               24.956437  61417.791564  2461  0.820333  2461.0  3000
B               29.876202  75915.430125  2541  0.847000  2541.0  3000
C               34.917589  90890.484142  2603  0.867667  2603.0  3000
checkout.groupby('checkout_page')['order_value'].sum()/
checkout.groupby('checkout_page')['purchased'].count()
checkout_page
A    20.472597
B    25.305143
C    30.296828
dtype: float64
Python으로 배우는 A/B Testing

델타 방법 분산

  • 델타 방법: 비율 지표 분산 추정{

델타 방법 분산 공식

# Delta method variance of ratio metric
def var_delta(x,y): 
    x_bar = np.mean(x)
    y_bar = np.mean(y)
    x_var = np.var(x,ddof=1)
    y_var = np.var(y,ddof=1)
    cov_xy = np.cov(x,y,ddof=1)[0][1]
    # Note that we divide by len(x) here because the denominator of the test statistic is standard error (=sqrt(var/n))
    var_ratio = (x_var/y_bar**2 + y_var*(x_bar**2/y_bar**4) - 2*cov_xy*(x_bar/y_bar**3))/len(x)
    return var_ratio
1 Budylin, Roman & Drutsa, Alexey & Katsev, Ilya & Tsoy, Valeriya. (2018). Consistent Transformation of Ratio Metrics for Efficient Online Controlled Experiments. 55-63. 10.1145/3159652.3159699.
Python으로 배우는 A/B Testing

델타 방법 z-검정

# Delta method ztest calculation 
ztest_delta(x_control,y_control,x_treatment,y_treatment, alpha = 0.05)

입력 인자:

  • x_control: 대조군 사용자 기준 비율 지표 분자 열
  • y_control: 대조군 사용자 기준 비율 지표 분모 열
  • x_treatment: 실험군 사용자 기준 비율 지표 분자 열
  • y_treatment: 실험군 사용자 기준 비율 지표 분모 열
  • alpha: 유의수준.

출력:

  • mean_control: 대조군 비율 지표 평균
  • mean_treatment: 실험군 비율 지표 평균
  • difference: 실험군-대조군 평균 차이
  • diff_CI: 평균 차이의 신뢰구간
  • p-value: 양측 z-검정 p-값
1 https://medium.com/@ahmadnuraziz3/applying-delta-method-for-a-b-tests-analysis-8b1d13411c22
Python으로 배우는 A/B Testing

Python 예시

# 변형 A, B의 사용자별 지표 DataFrame 생성
A_per_user = pd.DataFrame({'order_value':checkout[checkout['checkout_page']=='A'].groupby('user_id')['order_value'].sum()
                            ,'page_view':checkout[checkout['checkout_page']=='A'].groupby('user_id')['user_id'].count()})
B_per_user = pd.DataFrame({'order_value':checkout[checkout['checkout_page']=='B'].groupby('user_id')['order_value'].sum()
                           ,'page_view':checkout[checkout['checkout_page']=='B'].groupby('user_id')['user_id'].count()})

# 대조군/실험군 비율 지표 열 지정
x_control = A_per_user['order_value']
y_control = A_per_user['page_view']
x_treatment = B_per_user['order_value']
y_treatment = B_per_user['page_view']

# 비율 지표에 대한 z-검정 실행
ztest_delta(x_control,y_control,x_treatment,y_treatment)
{'mean_control': 20.472597188012,
 'mean_treatment': 25.30514337484097,
 'difference': 4.833,
 'diff_CI': '[4.257, 5.408]',
 'p-value': 5.954978880467735e-61}
Python으로 배우는 A/B Testing

Ayo berlatih!

Python으로 배우는 A/B Testing

Preparing Video For Download...