Python의 statsmodels로 배우는 중급 회귀
Maarten Van den Broeck
Content Developer at DataCamp
이 강의는 Introduction to Regression with statsmodels in Python의 내용을 전제로 합니다
복수 회귀는 둘 이상 설명 변수를 갖는 회귀 모델입니다.
설명 변수가 늘면 통찰이 늘고 예측이 더 좋아집니다.
| mass_g | length_cm | species |
|---|---|---|
| 242.0 | 23.2 | Bream |
| 5.9 | 7.5 | Perch |
| 200.0 | 30.0 | Pike |
| 40.0 | 12.9 | Roach |
mass_g는 반응 변수입니다from statsmodels.formula.api import ols
mdl_mass_vs_length = ols("mass_g ~ length_cm",
data=fish).fit()
print(mdl_mass_vs_length.params)
Intercept -536.223947
length_cm 34.899245
dtype: float64
mdl_mass_vs_species = ols("mass_g ~ species + 0",
data=fish).fit()
print(mdl_mass_vs_species.params)
species[Bream] 617.828571
species[Perch] 382.239286
species[Pike] 718.705882
species[Roach] 152.050000
dtype: float64
mdl_mass_vs_both = ols("mass_g ~ length_cm + species + 0",
data=fish).fit()
print(mdl_mass_vs_both.params)
species[Bream] -672.241866
species[Perch] -713.292859
species[Pike] -1089.456053
species[Roach] -726.777799
length_cm 42.568554
dtype: float64
print(mdl_mass_vs_length.params)
Intercept -536.223947
length_cm 34.899245
print(mdl_mass_vs_both.params)
species[Bream] -672.241866
species[Perch] -713.292859
species[Pike] -1089.456053
species[Roach] -726.777799
length_cm 42.568554
print(mdl_mass_vs_species.params)
species[Bream] 617.828571
species[Perch] 382.239286
species[Pike] 718.705882
species[Roach] 152.050000
import matplotlib.pyplot as plt
import seaborn as sns
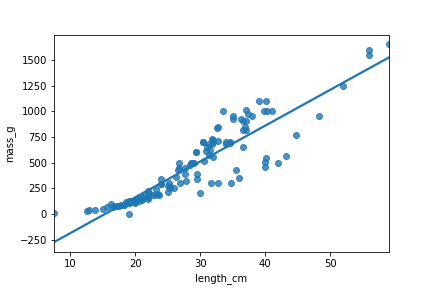
sns.regplot(x="length_cm",
y="mass_g",
data=fish,
ci=None)
plt.show()

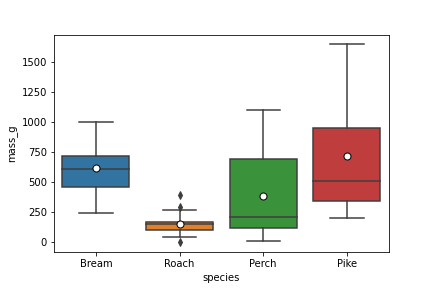
sns.boxplot(x="species",
y="mass_g",
data=fish,
showmeans=True)

coeffs = mdl_mass_vs_both.params
print(coeffs)
species[Bream] -672.241866
species[Perch] -713.292859
species[Pike] -1089.456053
species[Roach] -726.777799
length_cm 42.568554
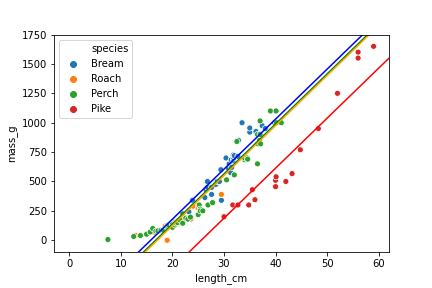
ic_bream, ic_perch, ic_pike, ic_roach, sl = coeffs
sns.scatterplot(x="length_cm",
y="mass_g",
hue="species",
data=fish)
plt.axline(xy1=(0, ic_bream), slope=sl, color="blue")
plt.axline(xy1=(0, ic_perch), slope=sl, color="green")
plt.axline(xy1=(0, ic_pike), slope=sl, color="red")
plt.axline(xy1=(0, ic_roach), slope=sl, color="orange")
Python의 statsmodels로 배우는 중급 회귀