Python의 statsmodels로 배우는 중급 회귀
Maarten Van den Broeck
Content Developer at DataCamp
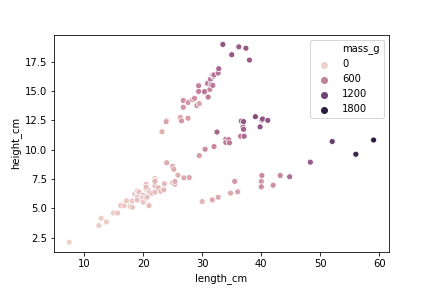
sns.scatterplot(x="length_cm",
                y="height_cm",
                data=fish,
                hue="mass_g")
mdl_mass_vs_both = ols("mass_g ~ length_cm + height_cm",
                       data=fish).fit()

print(mdl_mass_vs_both.params)
Intercept   -622.150234
length_cm     28.968405
height_cm     26.334804
from itertools import product

length_cm = np.arange(5, 61, 5)
height_cm = np.arange(2, 21, 2)

p = product(length_cm, height_cm)

explanatory_data = pd.DataFrame(p,
                                columns=["length_cm",
                                         "height_cm"])
prediction_data = explanatory_data.assign(
  mass_g = mdl_mass_vs_both.predict(explanatory_data))
print(prediction_data)
     length_cm  height_cm       mass_g
0            5          2  -424.638603
1            5          4  -371.968995
2            5          6  -319.299387
3            5          8  -266.629780
4            5         10  -213.960172
..         ...        ...          ...
115         60         12  1431.971694
116         60         14  1484.641302
117         60         16  1537.310909
118         60         18  1589.980517
119         60         20  1642.650125

[120 rows x 3 columns]
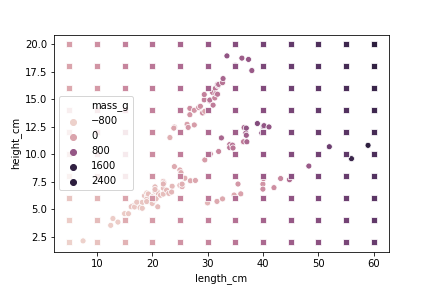
sns.scatterplot(x="length_cm", y="height_cm", data=prediction_data, hue="mass_g", legend=False, marker="s")
plt.show()
mdl_mass_vs_both_inter = ols("mass_g ~ length_cm * height_cm", data=fish).fit()
print(mdl_mass_vs_both_inter.params)
Intercept 159.107480 length_cm 0.301426 height_cm -78.125178 length_cm:height_cm 3.545435
length_cm = np.arange(5, 61, 5) height_cm = np.arange(2, 21, 2) p = product(length_cm, height_cm) explanatory_data = pd.DataFrame(p, columns=["length_cm", "height_cm"]) prediction_data = explanatory_data.assign( mass_g = mdl_mass_vs_both_inter.predict(explanatory_data))
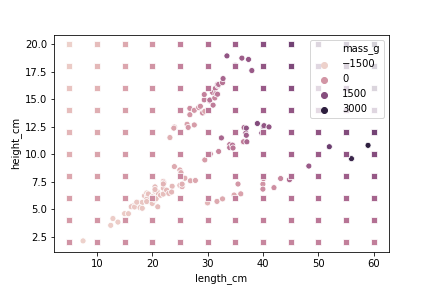
sns.scatterplot(x="length_cm",
                y="height_cm",
                data=fish,
                hue="mass_g")
sns.scatterplot(x="length_cm", y="height_cm", data=prediction_data, hue="mass_g", legend=False, marker="s")