시계열을 정상화하기

Python으로 배우는 ARIMA 모델

James Fulton

Climate informatics researcher

개요

  • 정상성 검정 소개
  • 데이터셋을 정상화하기
Python으로 배우는 ARIMA 모델

확장 Dickey-Fuller 검정

  • 추세 비정상성 검정
  • 귀무가설: 시계열은 비정상
Python으로 배우는 ARIMA 모델

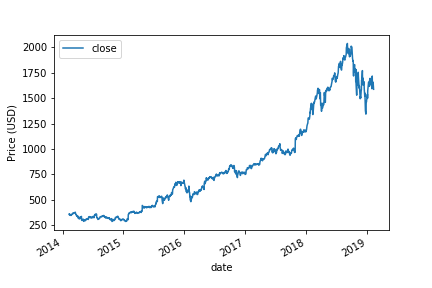
adfuller 적용하기

from statsmodels.tsa.stattools import adfuller

results = adfuller(df['close'])
Python으로 배우는 ARIMA 모델

검정 결과 해석하기

print(results)
(-1.34, 0.60, 23, 1235, {'1%': -3.435, '5%': -2.913, '10%': -2.568}, 10782.87)
  • 0번째 요소: 검정통계량 (-1.34)
    • 더 작을수록(음의 방향) 정상일 가능성이 큼
  • 1번째 요소: p-값 (0.60)
    • p-값이 작으면 귀무가설 기각 → 비정상성 기각
  • 4번째 요소: 임계값들
Python으로 배우는 ARIMA 모델

검정 결과 해석하기

print(results)
(-1.34, 0.60, 23, 1235, {'1%': -3.435, '5%': -2.863, '10%': -2.568}, 10782.87)
  • 0번째 요소: 검정통계량 (-1.34)
    • 더 작을수록(음의 방향) 정상일 가능성이 큼
  • 1번째 요소: p-값 (0.60)
    • p-값이 작으면 귀무가설 기각 → 비정상성 기각
  • 4번째 요소: 임계값들
1 https://www.statsmodels.org/dev/generated/statsmodels.tsa.stattools.adfuller.html
Python으로 배우는 ARIMA 모델

시각화의 가치

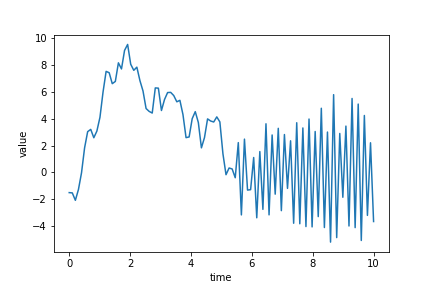
  • 시계열을 그리면 잘못된 가정을 피할 수 있습니다
Python으로 배우는 ARIMA 모델

시각화의 가치

Python으로 배우는 ARIMA 모델

시계열을 정상화하는 방법

Python으로 배우는 ARIMA 모델

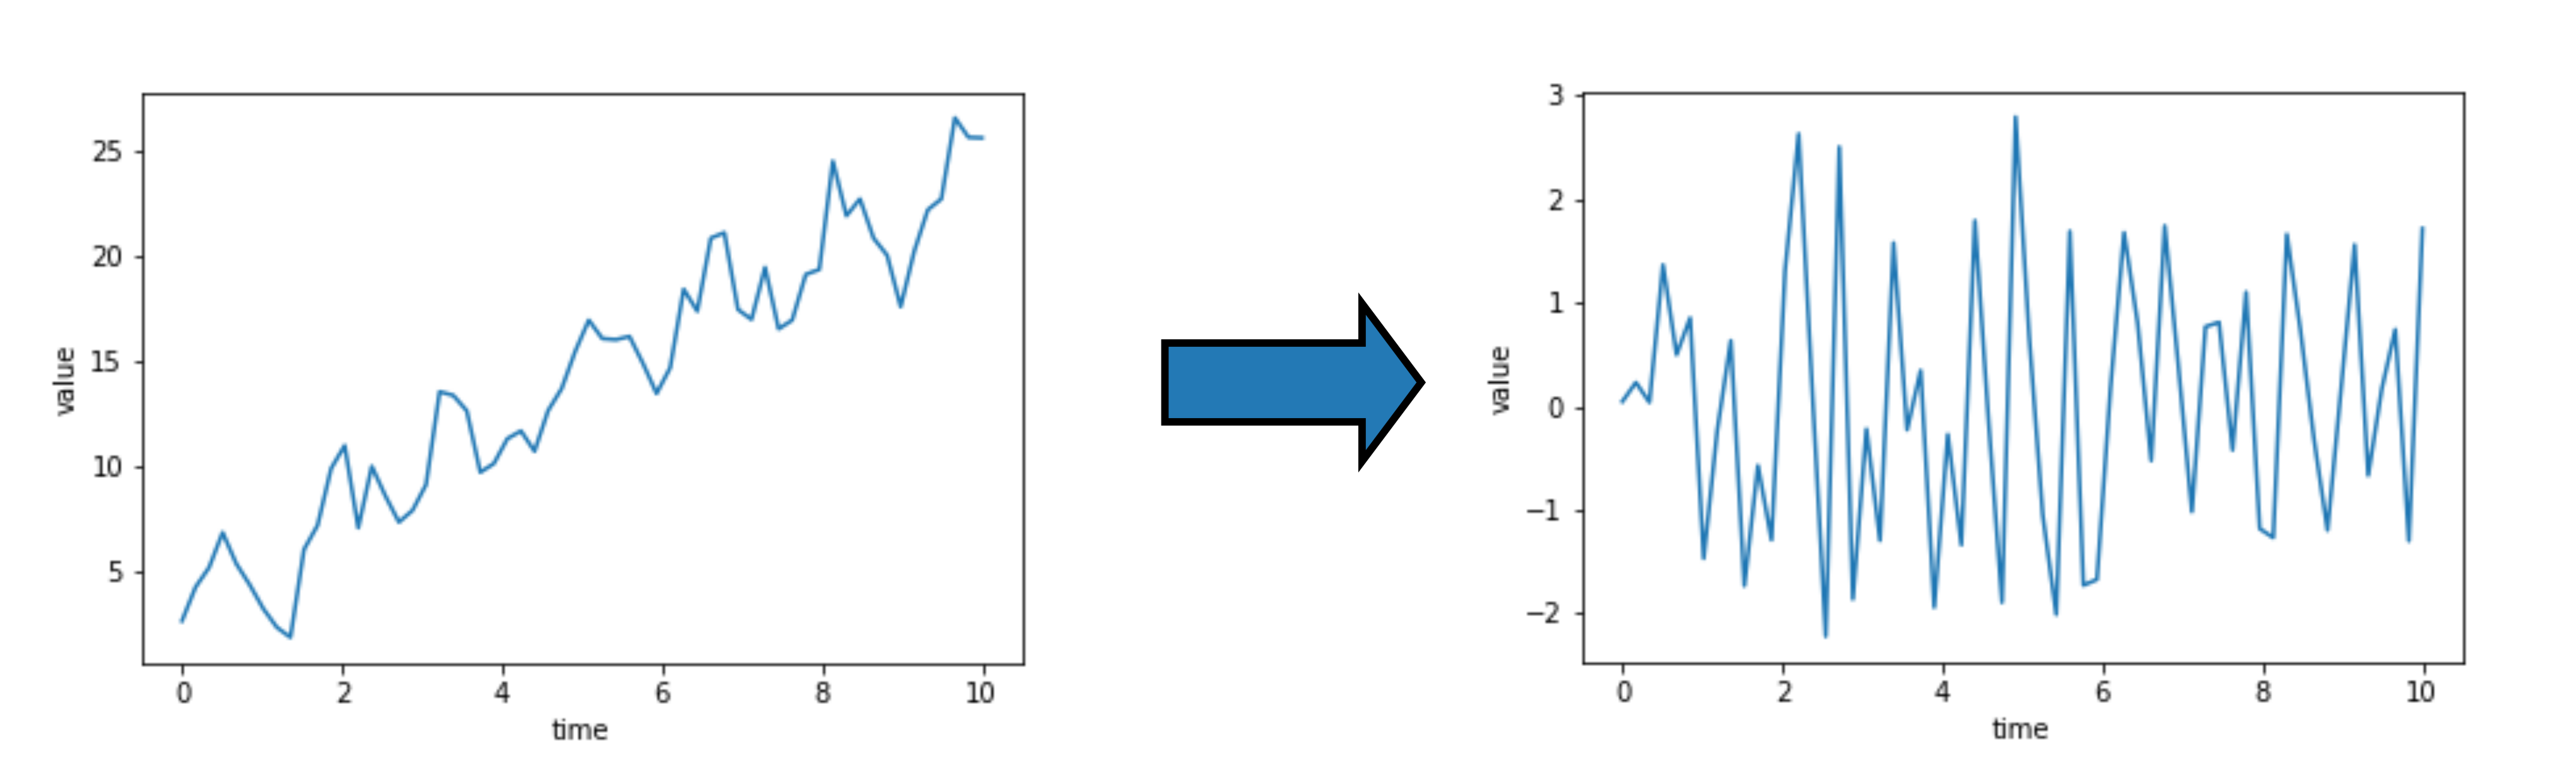
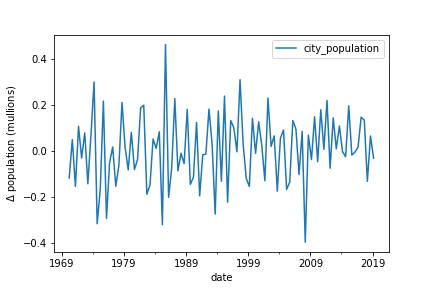
차분하기

차분: $\Delta y_t = y_t - y_{t-1}$

Python으로 배우는 ARIMA 모델

차분하기

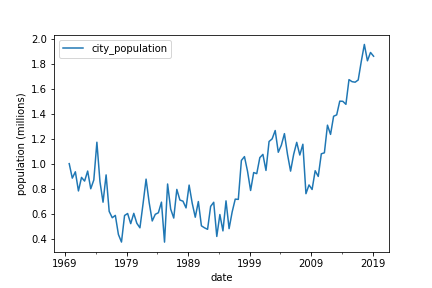
df_stationary = df.diff()
            city_population
date                       
1969-09-30              NaN
1970-03-31        -0.116156
1970-09-30         0.050850
1971-03-31        -0.153261
1971-09-30         0.108389
Python으로 배우는 ARIMA 모델

차분하기

df_stationary = df.diff().dropna()
            city_population
date                       
1970-03-31        -0.116156
1970-09-30         0.050850
1971-03-31        -0.153261
1971-09-30         0.108389
1972-03-31        -0.029569
Python으로 배우는 ARIMA 모델

차분하기

Python으로 배우는 ARIMA 모델

기타 변환

다른 변환 예시

  • 로그 변환
    • np.log(df)
  • 제곱근 변환
    • np.sqrt(df)
  • 비율 변화
    • df.shift(1)/df
Python으로 배우는 ARIMA 모델

연습해 봅시다!

Python으로 배우는 ARIMA 모델

Preparing Video For Download...