Python으로 배우는 ARIMA 모델
James Fulton
Climate informatics researcher
시계열은 어디에나 있습니다
다음을 학습합니다
import pandas as pd
import matplotlib as plt
df = pd.read_csv('time_series.csv', index_col='date', parse_dates=True)
date values
2019-03-11 5.734193
2019-03-12 6.288708
2019-03-13 5.205788
2019-03-14 3.176578
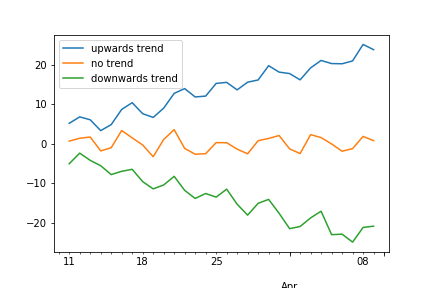
fig, ax = plt.subplots()
df.plot(ax=ax)
plt.show()


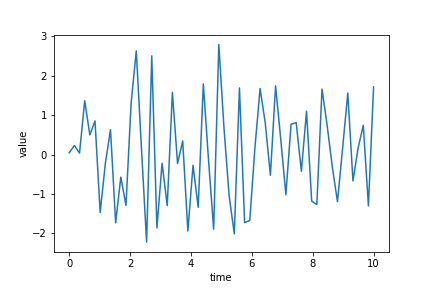
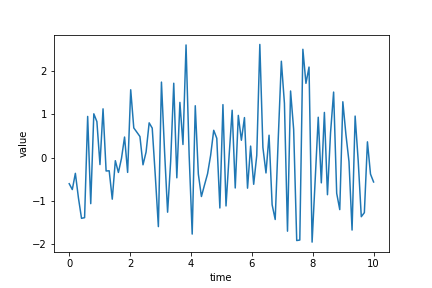
백색잡음 시계열은 값들이 상관되지 않습니다
정상적임

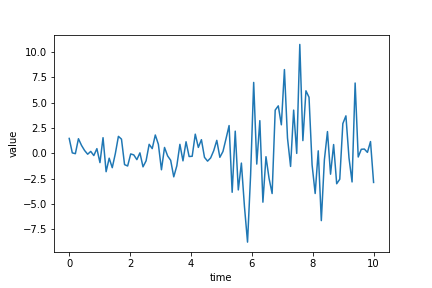
비정상적임

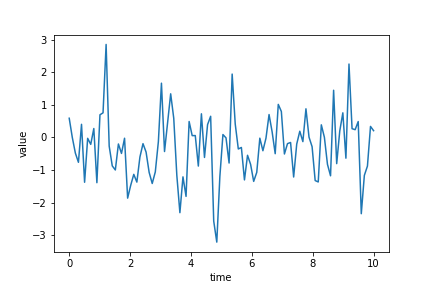
정상적임

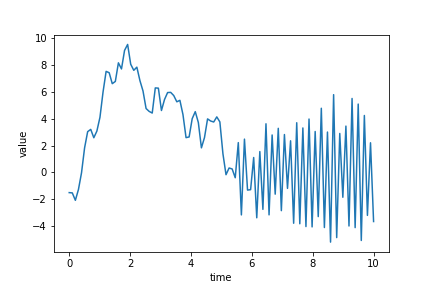
비정상적임

정상적임

비정상적임

# Train data - all data up to the end of 2018
df_train = df.loc[:'2018']
# Test data - all data from 2019 onwards
df_test = df.loc['2019':]
Python으로 배우는 ARIMA 모델