맞춤형 ggplot2 테마

Tidyverse로 데이터 소통하기

Timo Grossenbacher

Data Journalist

맞춤형 스타일의 장점

Tidyverse로 데이터 소통하기

theme() 함수

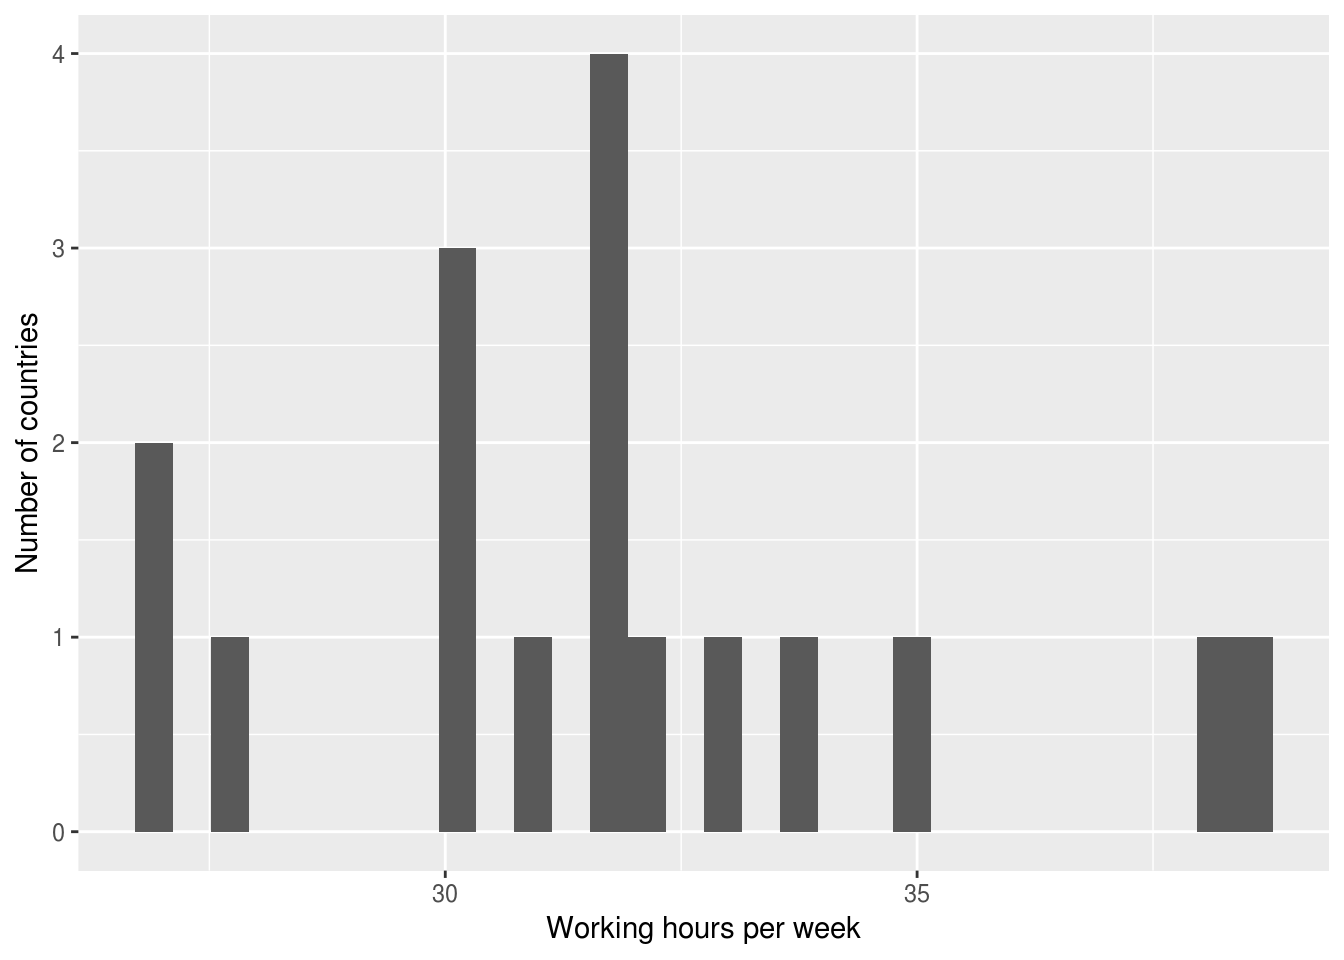
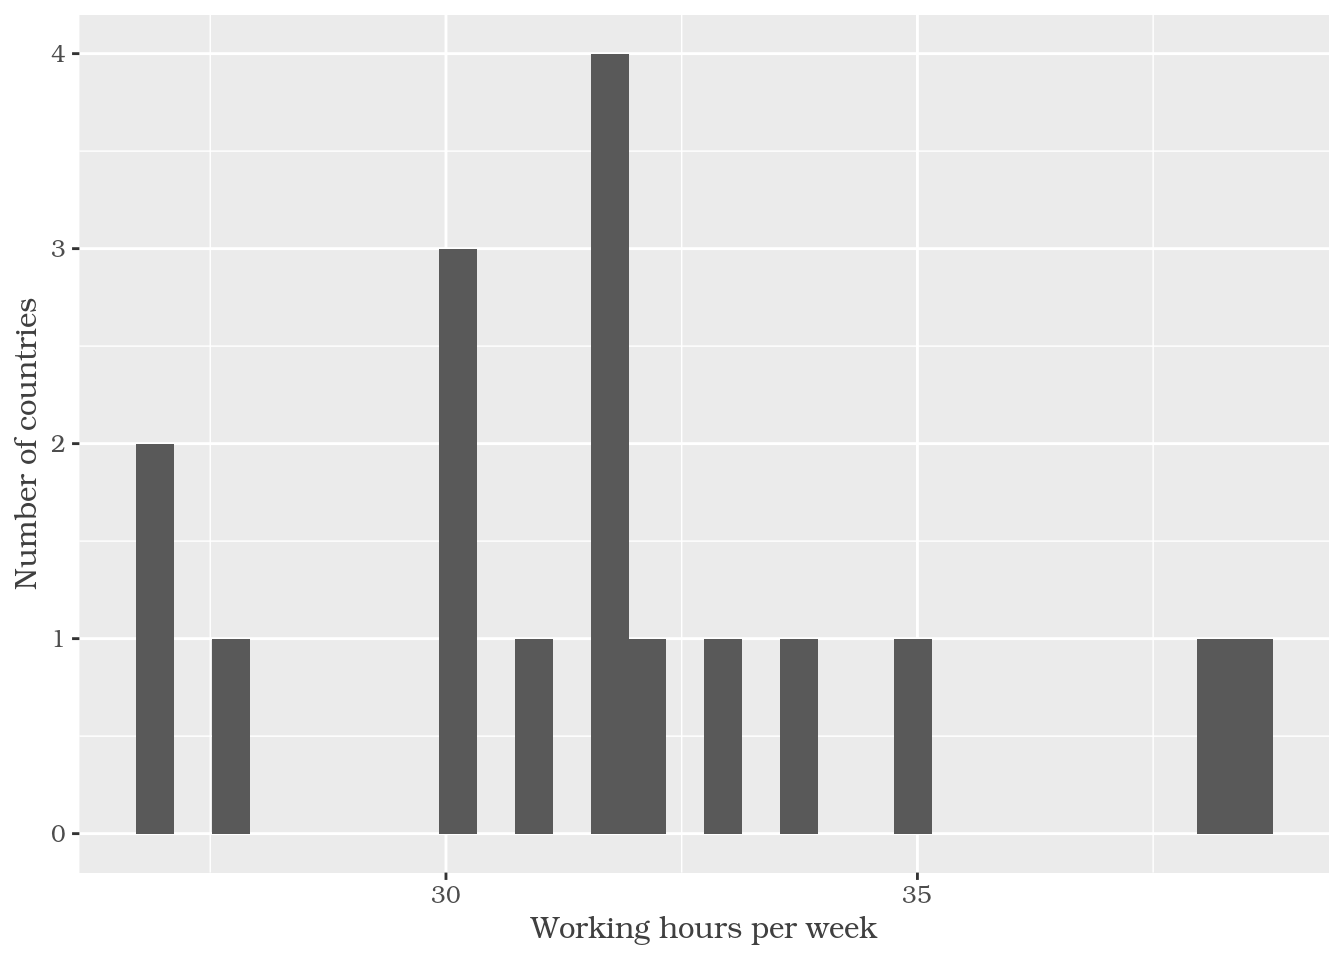
ggplot(plot_data) +
  geom_histogram(aes(
    x = working_hours)) +
  labs(x = "Working hours per week",
       y = "Number of countries") +
  theme(
    text = element_text(
      family = "Bookman",
      color = "gray25")
  )

Tidyverse로 데이터 소통하기

ggplot2 기본 테마

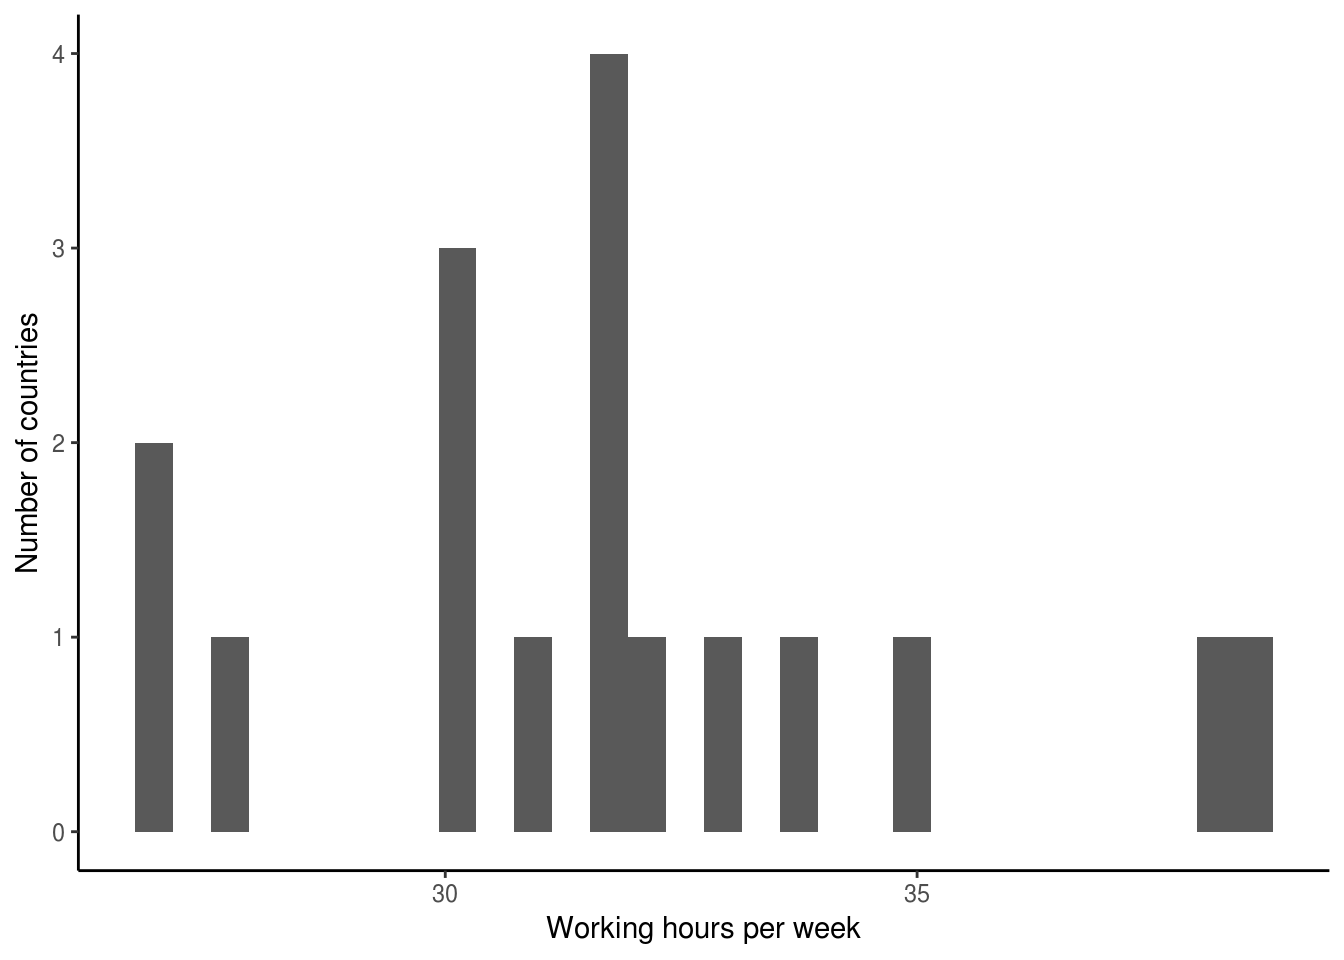
ggplot(plot_data) +
  geom_histogram(aes(
    x = working_hours)) +
  labs(x = "Working hours per week",
       y = "Number of countries") +

  theme_classic()

Tidyverse로 데이터 소통하기

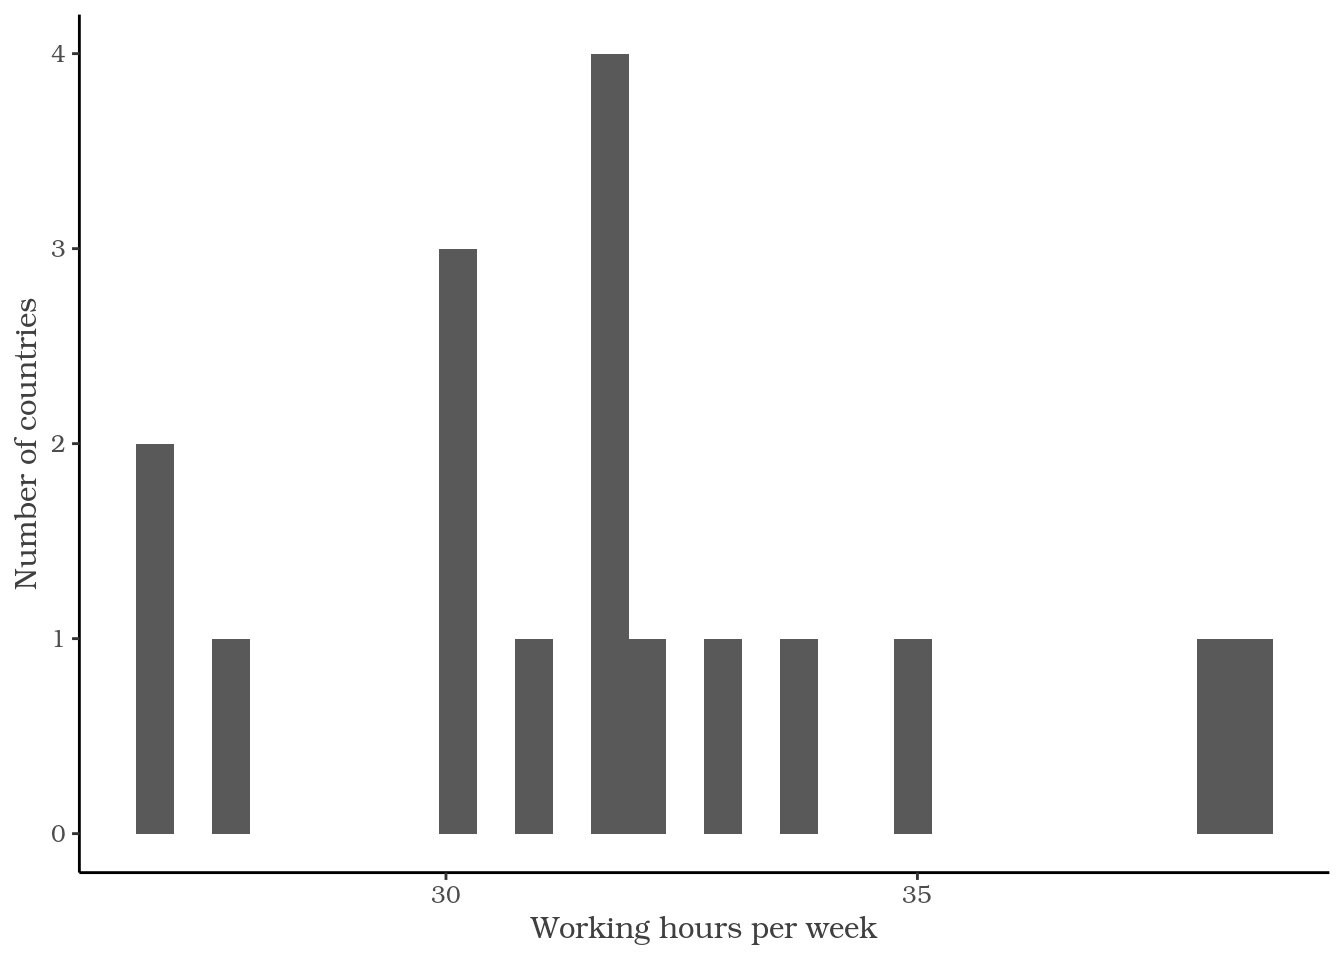
theme() 호출 연결하기

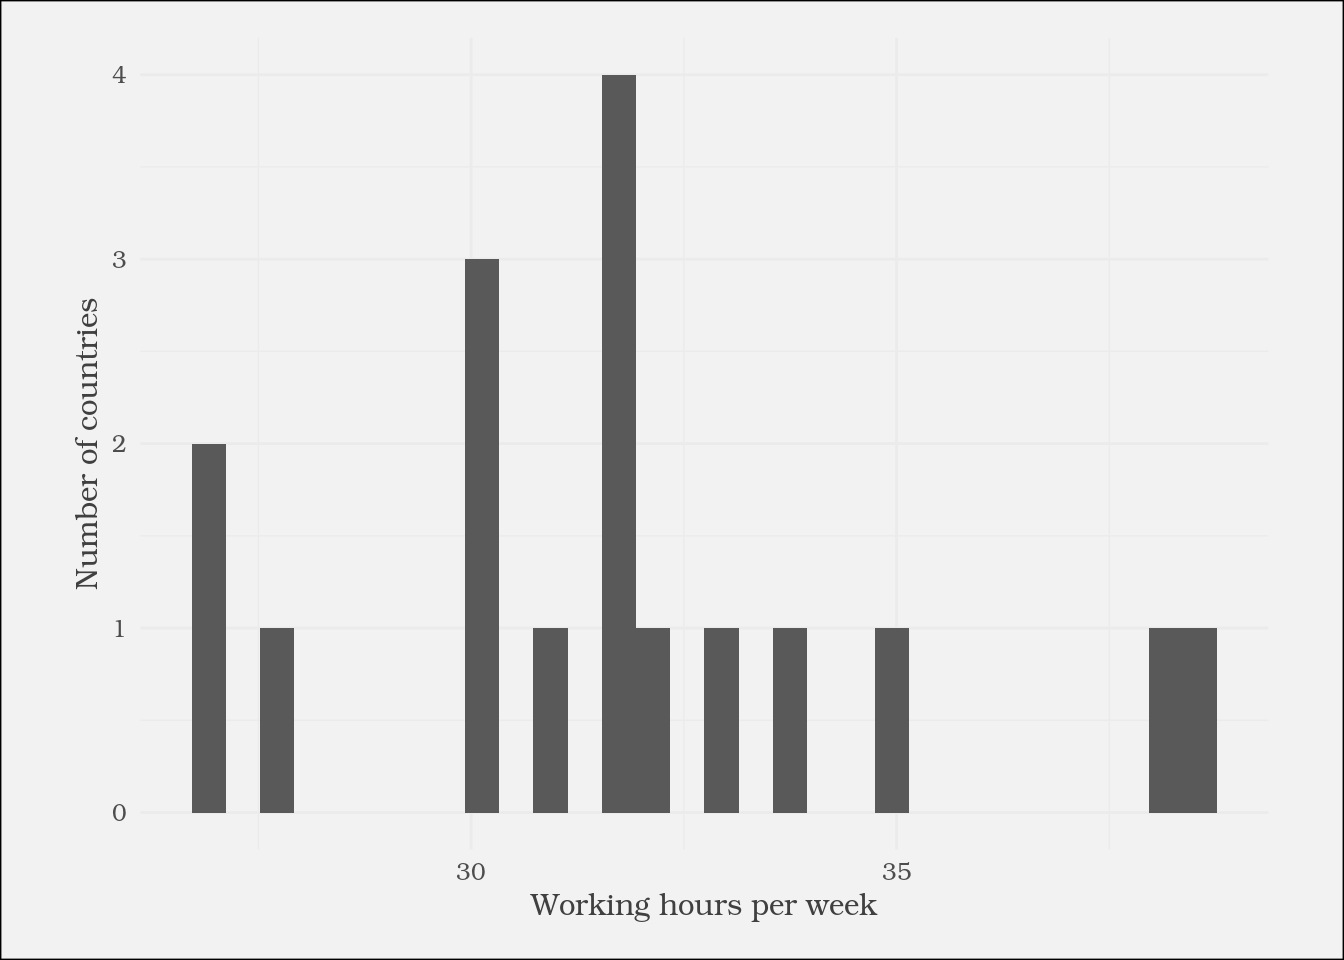
ggplot(plot_data) +
  geom_histogram(aes(
    x = working_hours)) +
  labs(x = "Working hours per week",
       y = "Number of countries") +

  theme_classic() +
  theme(
    text = element_text(
      family = "Bookman",
      color = "gray25")
  )

Tidyverse로 데이터 소통하기

테마 설정 옵션

?theme

axis.title
축 레이블 (element_text; text에서 상속)

axis.title.x
x축 레이블 (element_text; axis.title에서 상속)

axis.title.x.top
위쪽 x축 레이블 (element_text; axis.title.x에서 상속)

axis.title.x.bottom
아래쪽 x축 레이블 (element_text; axis.title.x에서 상속)

Tidyverse로 데이터 소통하기

element_* 함수 계열

element_text()
element_rect()
element_line()
element_blank()
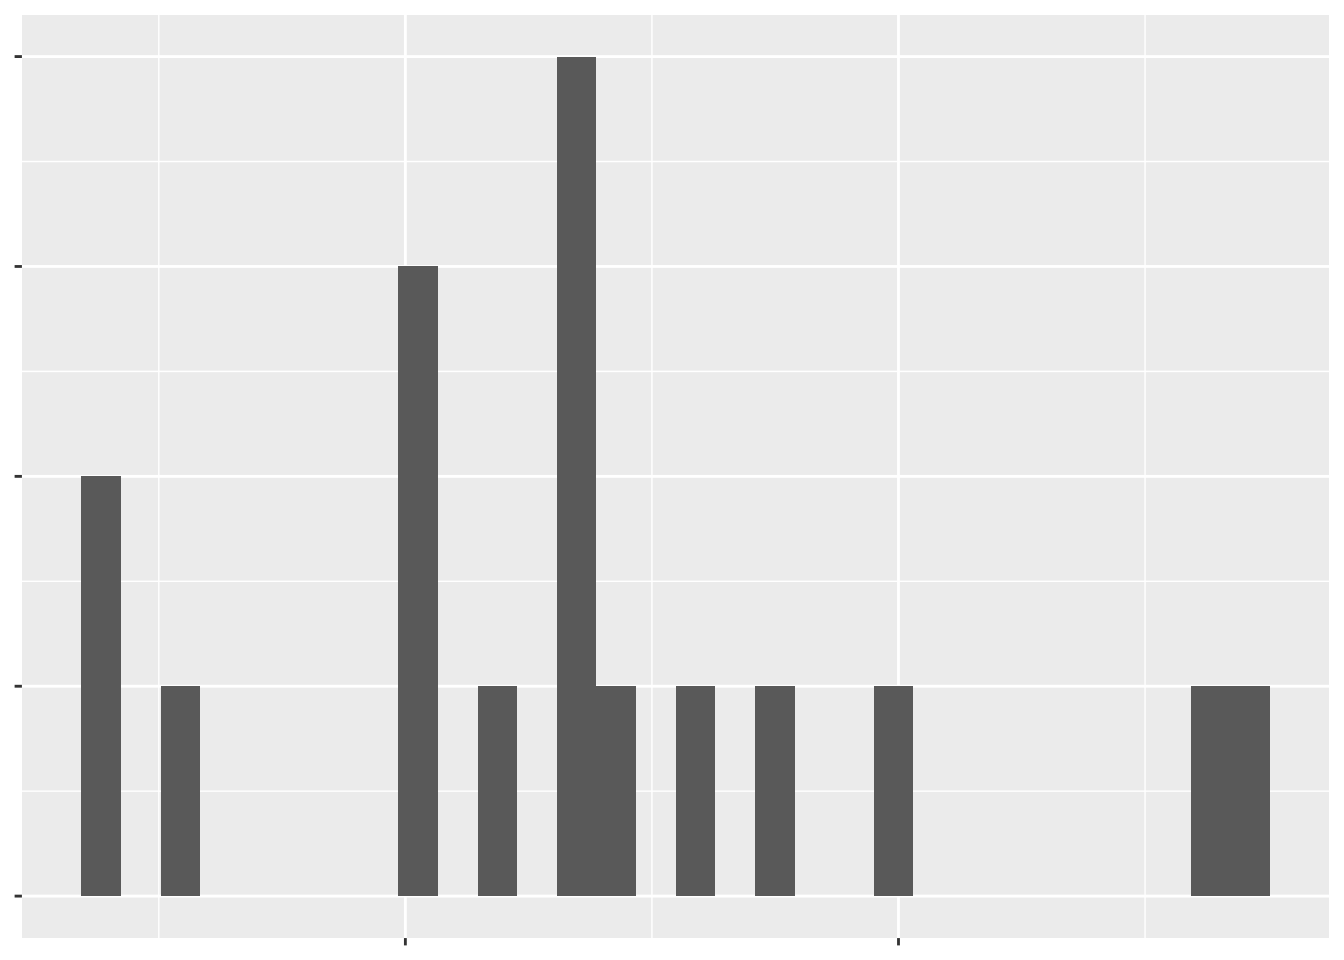
ggplot(plot_data) +
  geom_histogram(aes(
    x = working_hours)) +
  labs(x = "Working hours per week",
       y = "Number of countries") +
  theme(
    text = element_blank()
  )

Tidyverse로 데이터 소통하기

테마를 직접 사용해 보세요!

Tidyverse로 데이터 소통하기

Preparing Video For Download...