고차원 데이터의 t-SNE 시각화

Python으로 배우는 차원 축소

Jeroen Boeye

Head of Machine Learning, Faktion

IRIS 데이터셋의 t-SNE
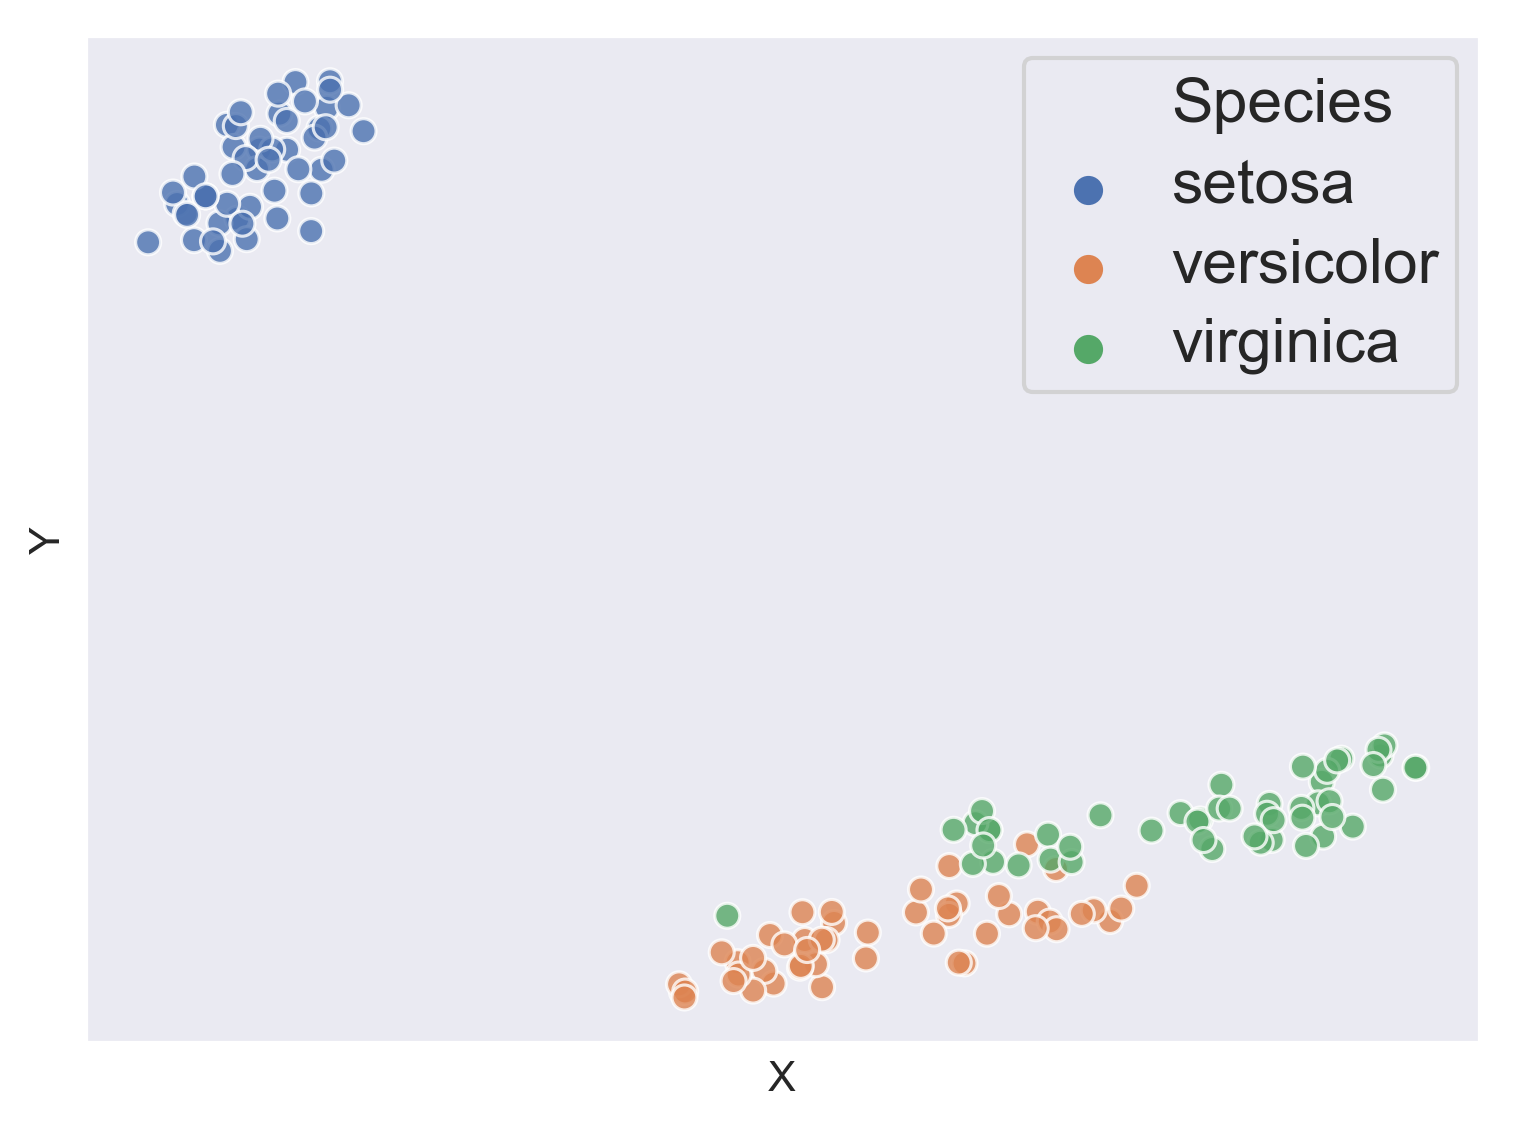
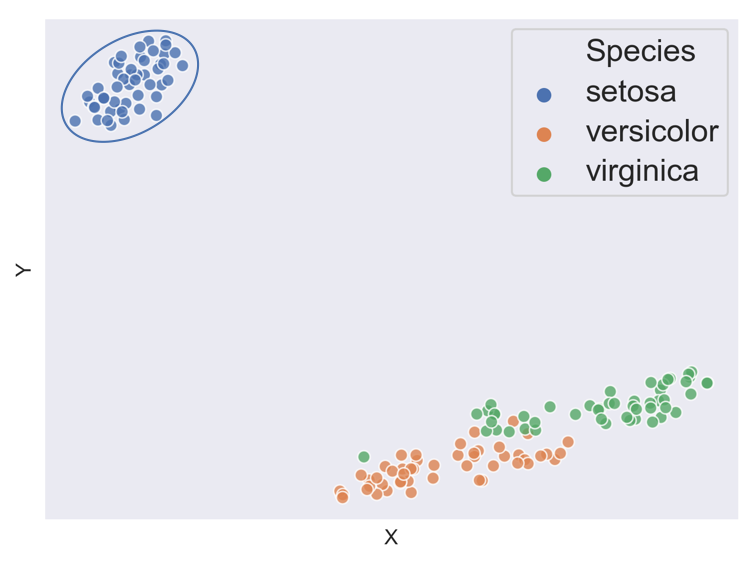
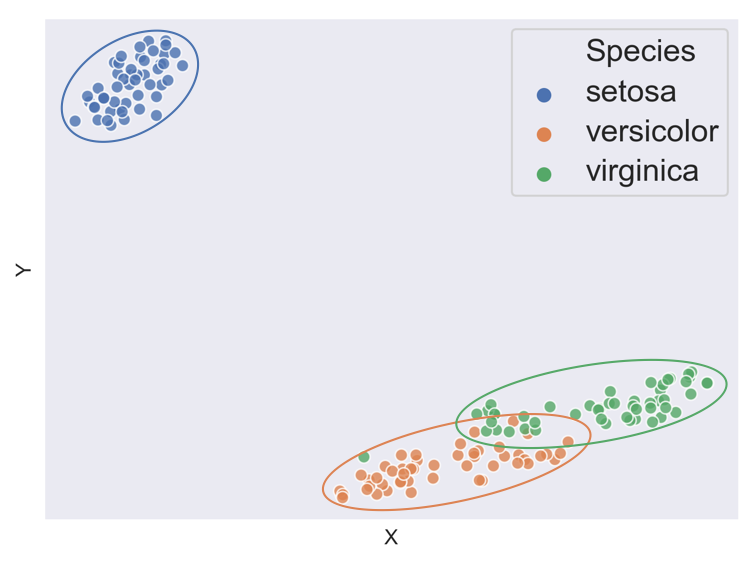
IRIS 클러스터

Python으로 배우는 차원 축소

IRIS 데이터셋의 t-SNE

IRIS 클러스터 1 주석

Python으로 배우는 차원 축소

IRIS 데이터셋의 t-SNE

IRIS 클러스터 3 주석

Python으로 배우는 차원 축소

여성 ANSUR 데이터셋의 t-SNE

df.shape
(1986, 99)
non_numeric = ['BMI_class', 'Height_class', 
               'Gender',  'Component', 'Branch']

df_numeric = df.drop(non_numeric, axis=1)

df_numeric.shape
(1986, 94)
Python으로 배우는 차원 축소

t-SNE 적합

from sklearn.manifold import TSNE

m = TSNE(learning_rate=50)
tsne_features = m.fit_transform(df_numeric)

tsne_features[1:4,:]
array([[-37.962185,  15.066088],
       [-21.873512,  26.334448],
       [ 13.97476 ,  22.590828]], dtype=float32)
Python으로 배우는 차원 축소

t-SNE 특성을 데이터셋에 할당하기

tsne_features[1:4,:]
array([[-37.962185,  15.066088],
       [-21.873512,  26.334448],
       [ 13.97476 ,  22.590828]], dtype=float32)
df['x'] = tsne_features[:,0]

df['y'] = tsne_features[:,1]
Python으로 배우는 차원 축소

t-SNE 플로팅

import seaborn as sns

sns.scatterplot(x="x", y="y", data=df)

plt.show()
Python으로 배우는 차원 축소

t-SNE 플로팅

ansur 포인트 클라우드

Python으로 배우는 차원 축소

BMI 범주에 따른 색상 지정

import seaborn as sns
import matplotlib.pyplot as plt

sns.scatterplot(x="x", y="y", hue='BMI_class', data=df)

plt.show()
Python으로 배우는 차원 축소

BMI 범주에 따른 색상 지정

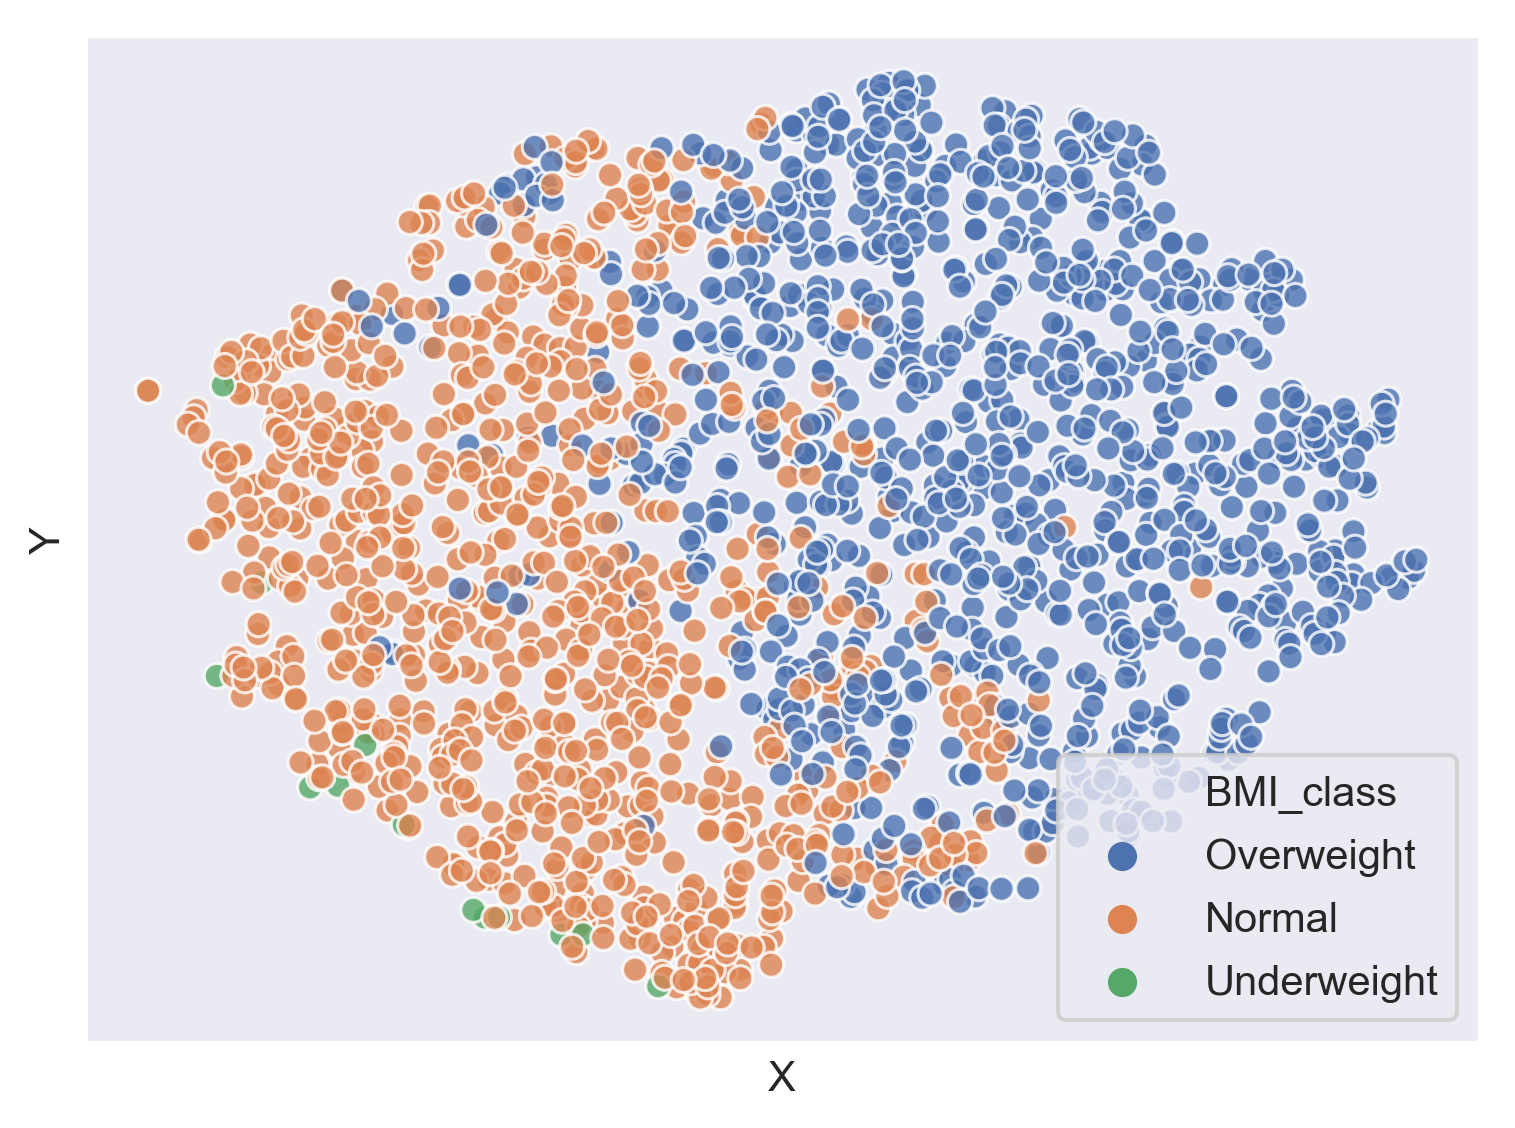
ansur 포인트 클라우드 BMI

Python으로 배우는 차원 축소

BMI 범주에 따른 색상 지정

ansur 포인트 클라우드 BMI 주석

Python으로 배우는 차원 축소

키 범주에 따른 색상 지정

import seaborn as sns

import matplotlib.pyplot as plt

sns.scatterplot(x="x", y="y", hue='Height_class', data=df)

plt.show()
Python으로 배우는 차원 축소

키 범주에 따른 색상 지정

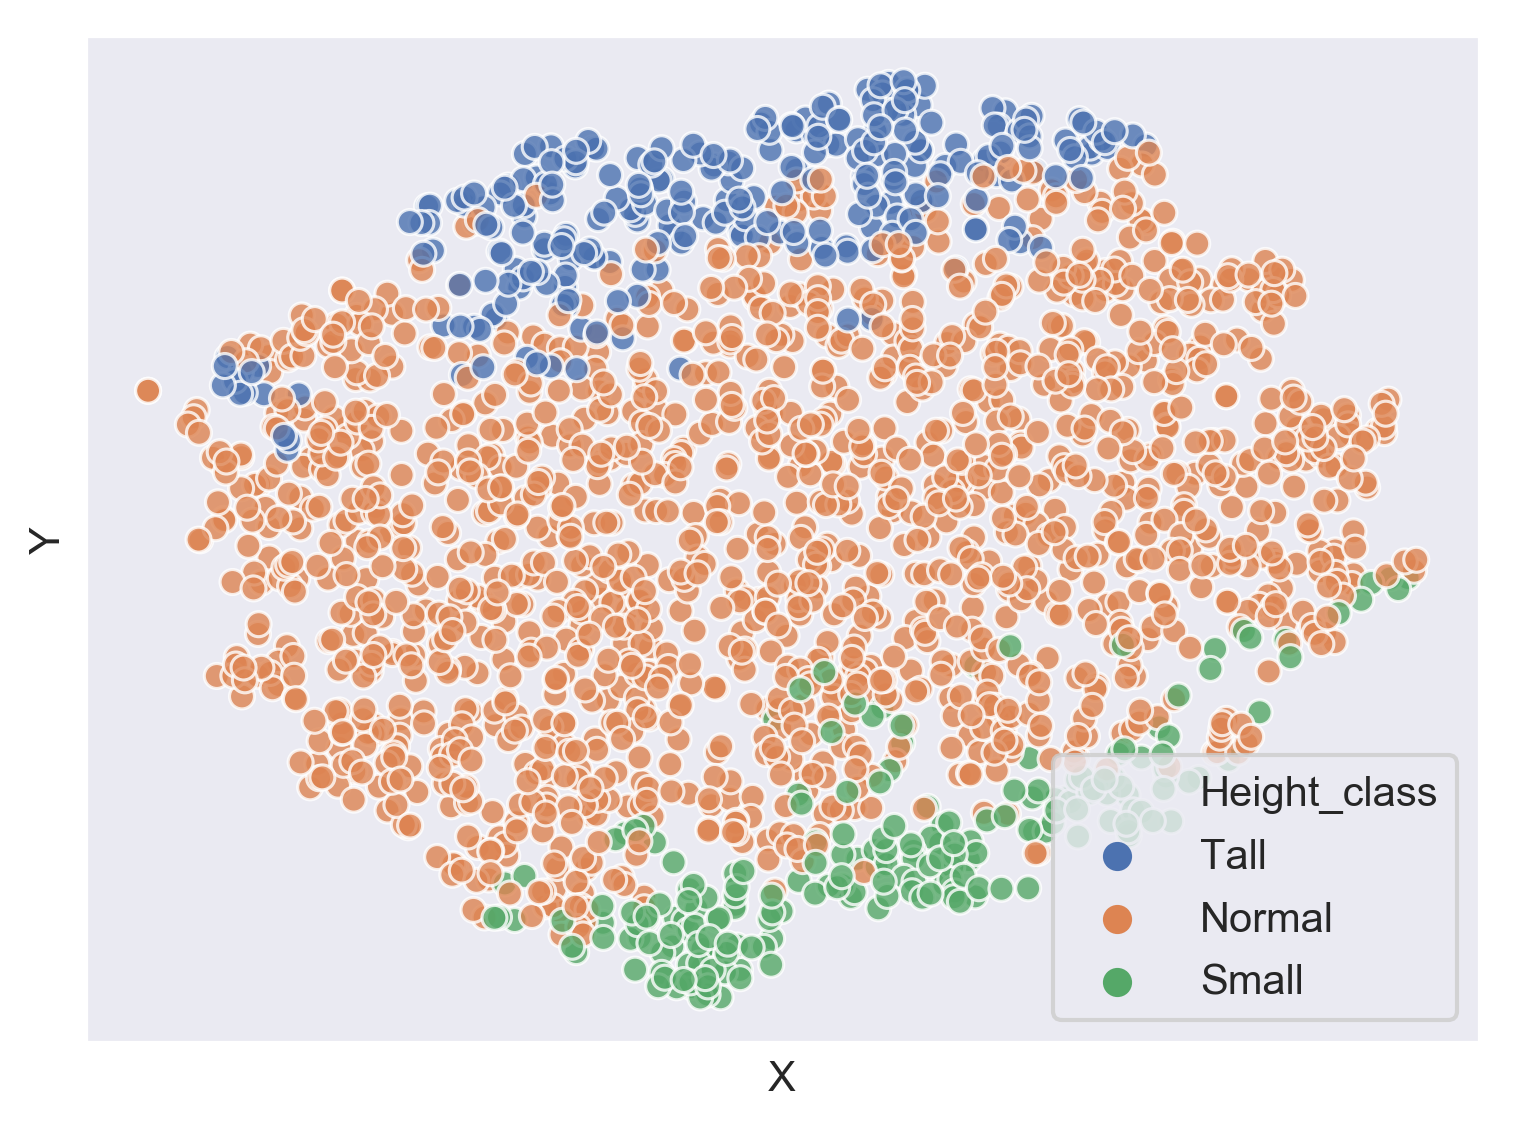
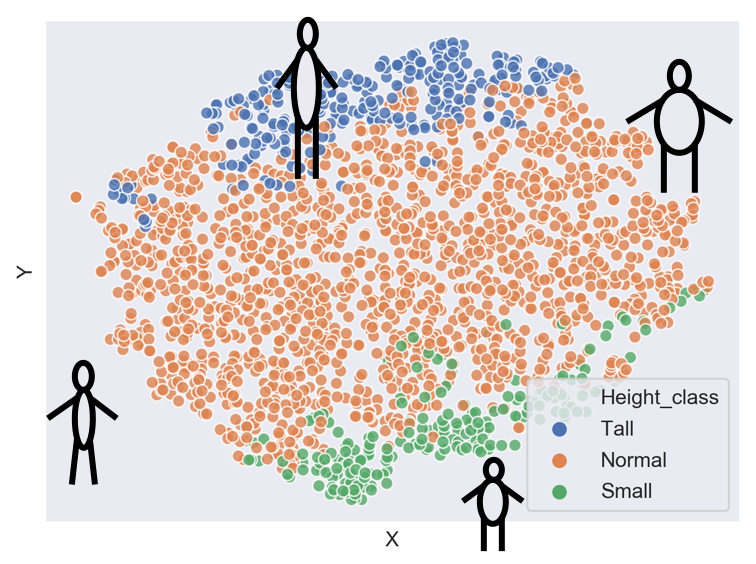
ansur 포인트 클라우드 키

Python으로 배우는 차원 축소

키 범주에 따른 색상 지정

ansur 포인트 클라우드 이중 주석

Python으로 배우는 차원 축소

연습해 봅시다!

Python으로 배우는 차원 축소

Preparing Video For Download...