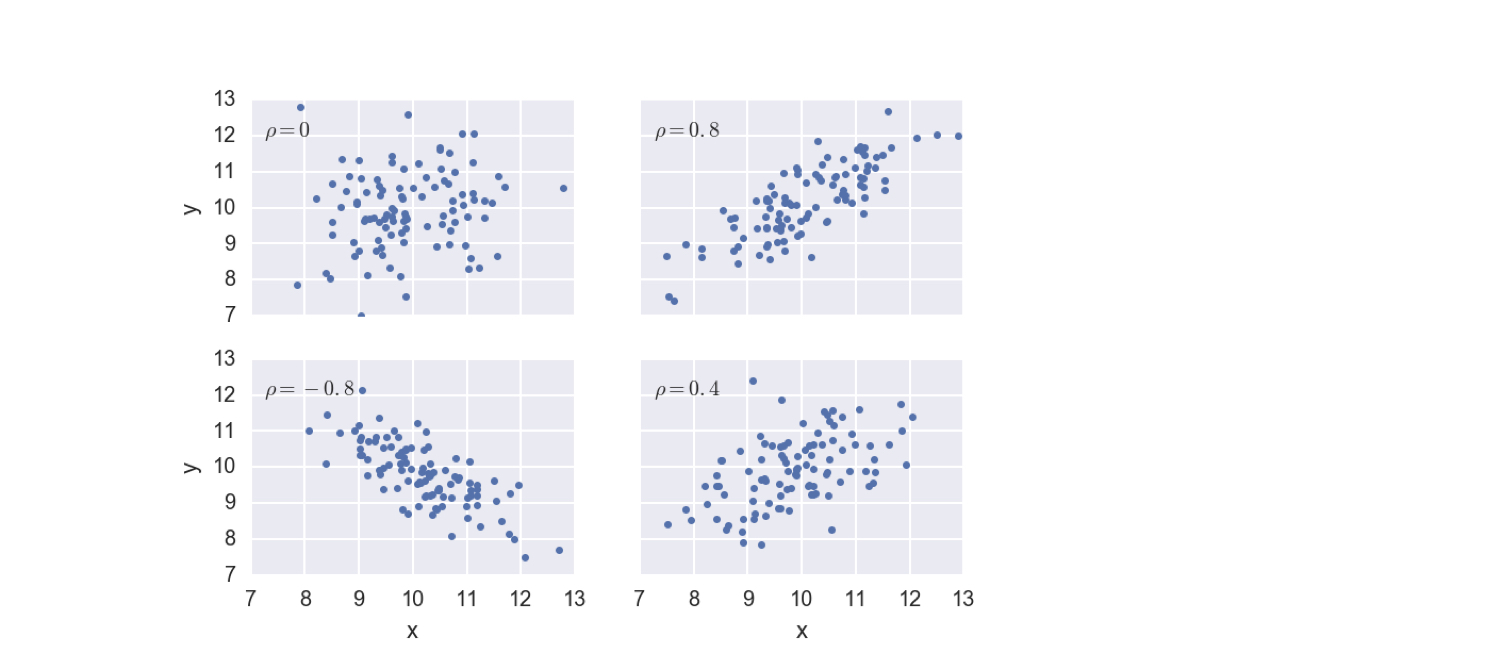
공분산과 피어슨 상관계수
Python으로 하는 Statistical Thinking (파트 1)

Justin Bois
Teaching Professor at the California Institute of Technology
2008년 미국 스윙스테이트 선거 결과
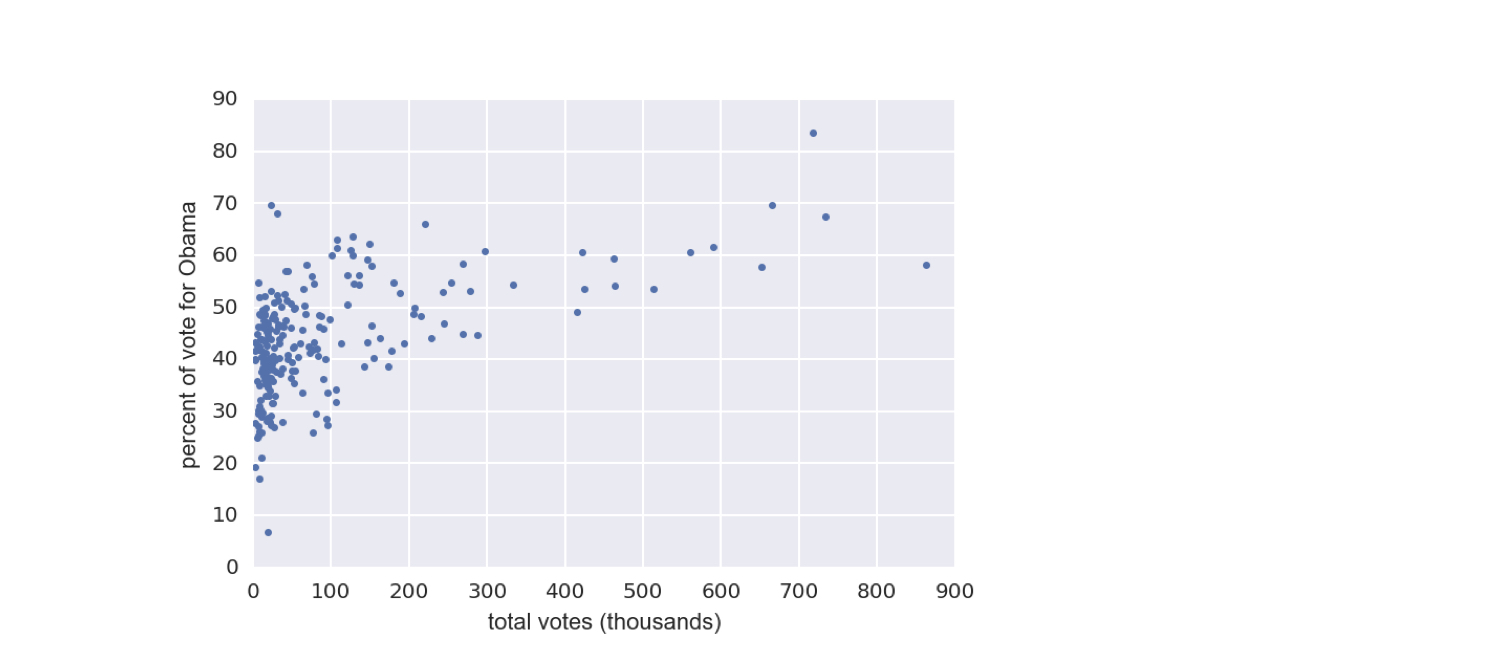
1 Data retrieved from Data.gov (https://www.data.gov/)
2008년 미국 스윙스테이트 선거 결과
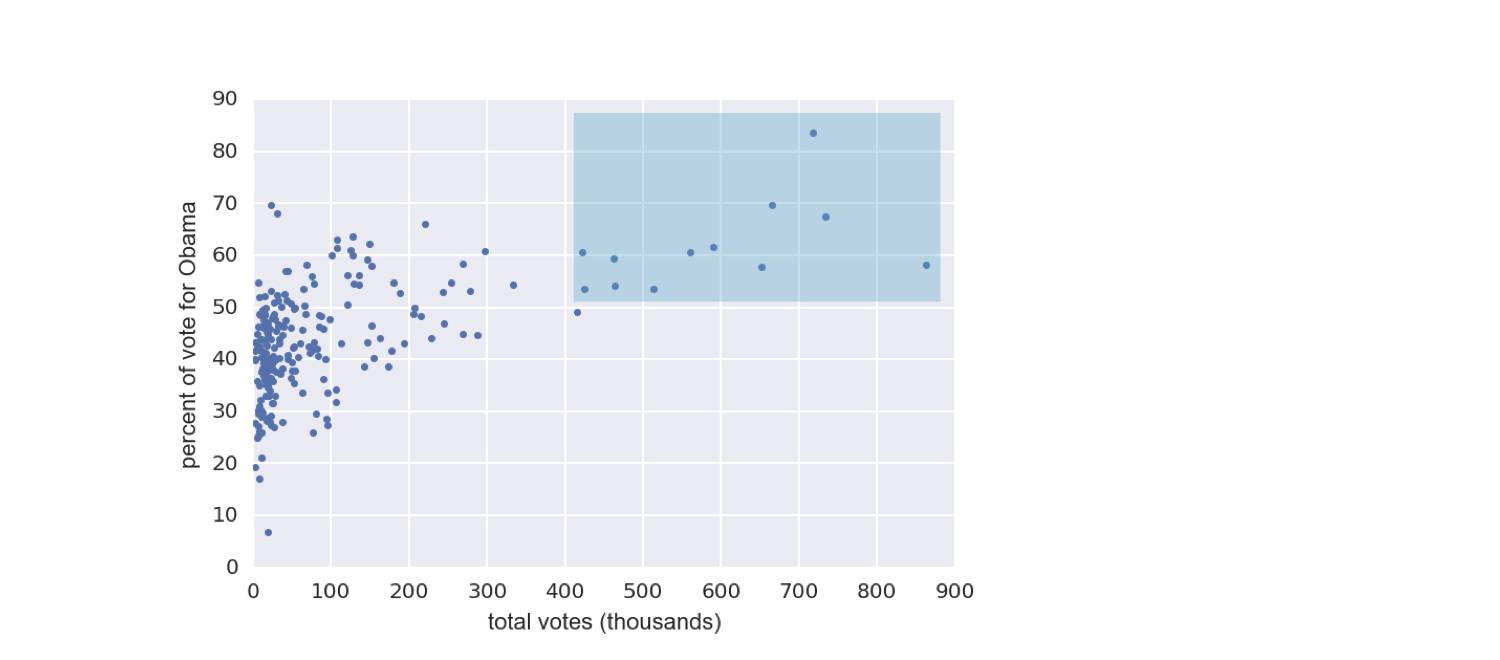
1 Data retrieved from Data.gov (https://www.data.gov/)
2008년 미국 스윙스테이트 선거 결과
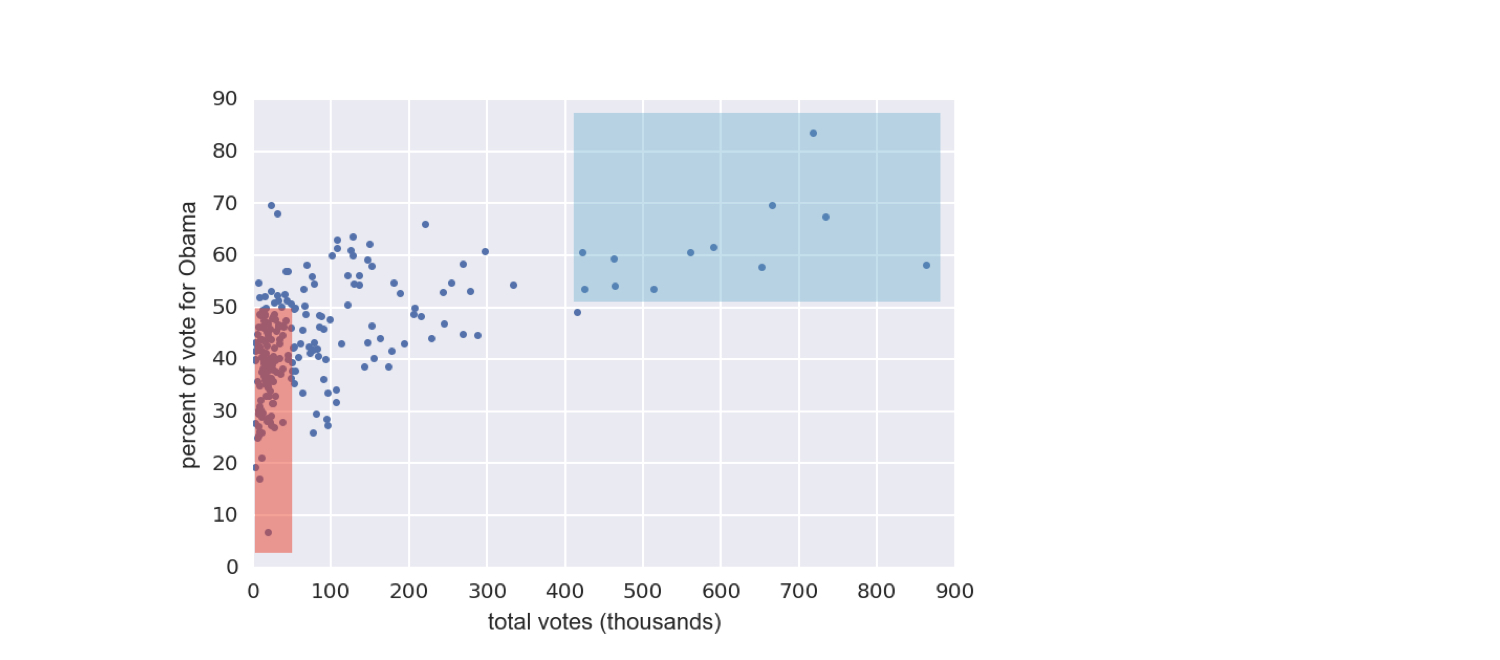
1 Data retrieved from Data.gov (https://www.data.gov/)
공분산 계산
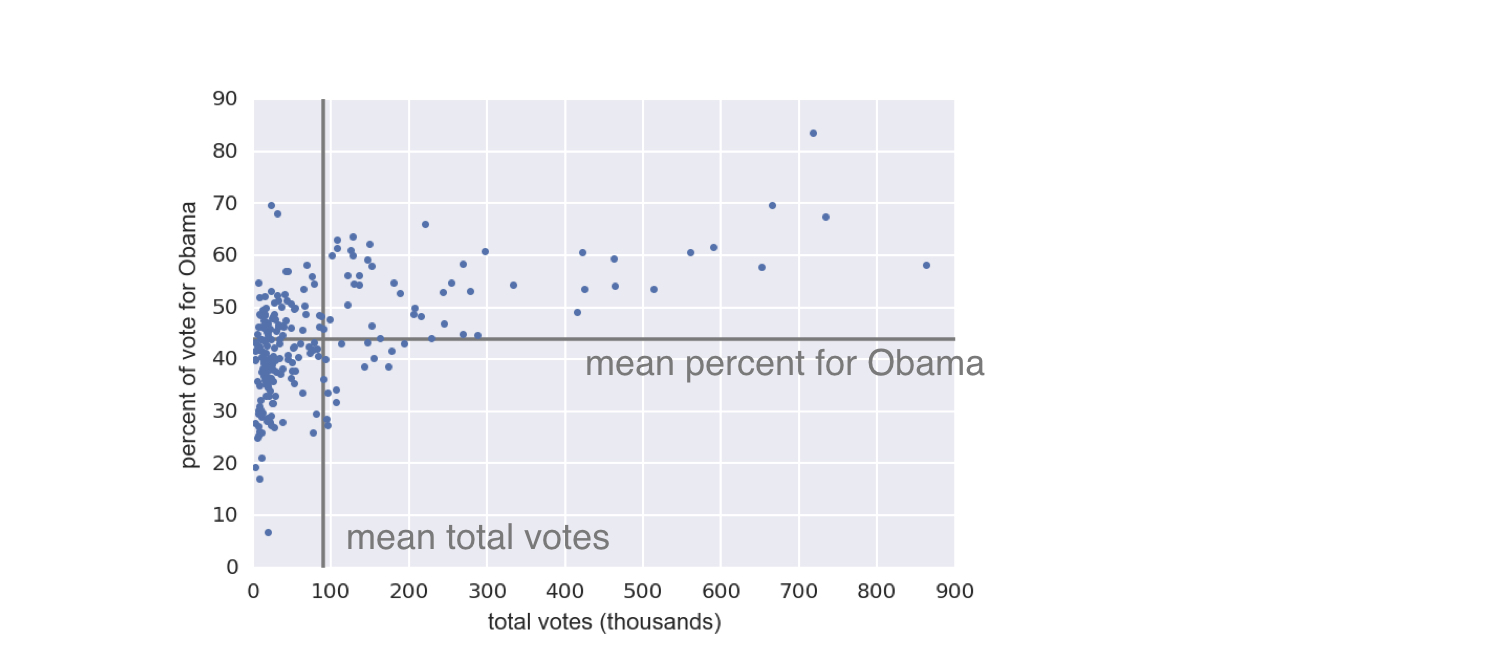
1 Data retrieved from Data.gov (https://www.data.gov/)
공분산 계산
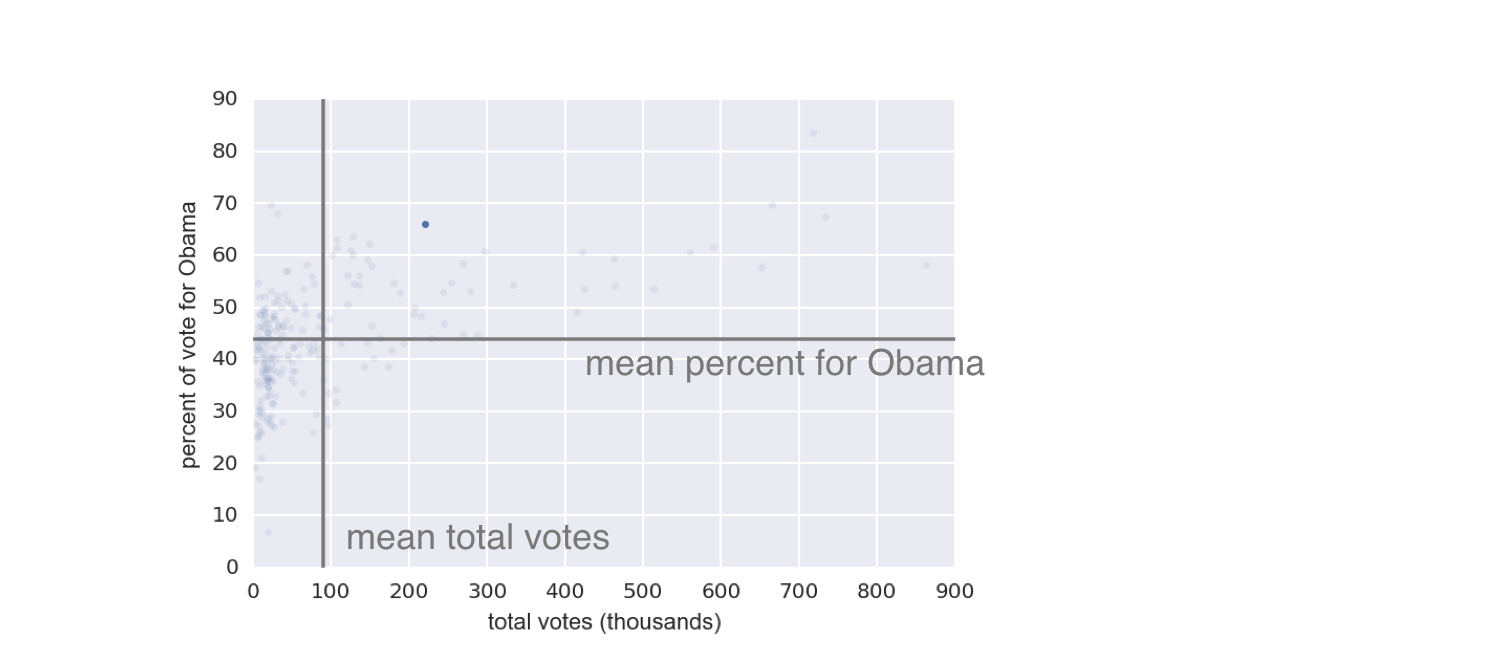
1 Data retrieved from Data.gov (https://www.data.gov/)
공분산 계산
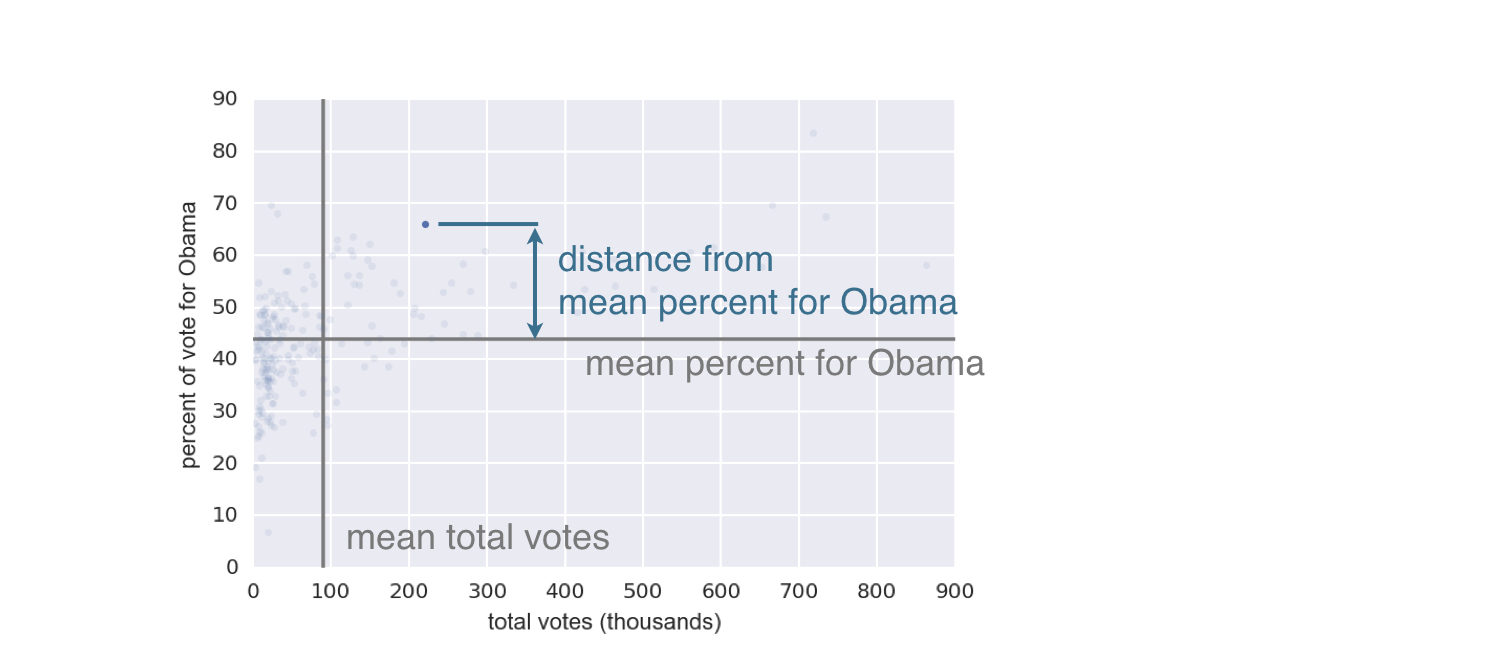
1 Data retrieved from Data.gov (https://www.data.gov/)
공분산 계산
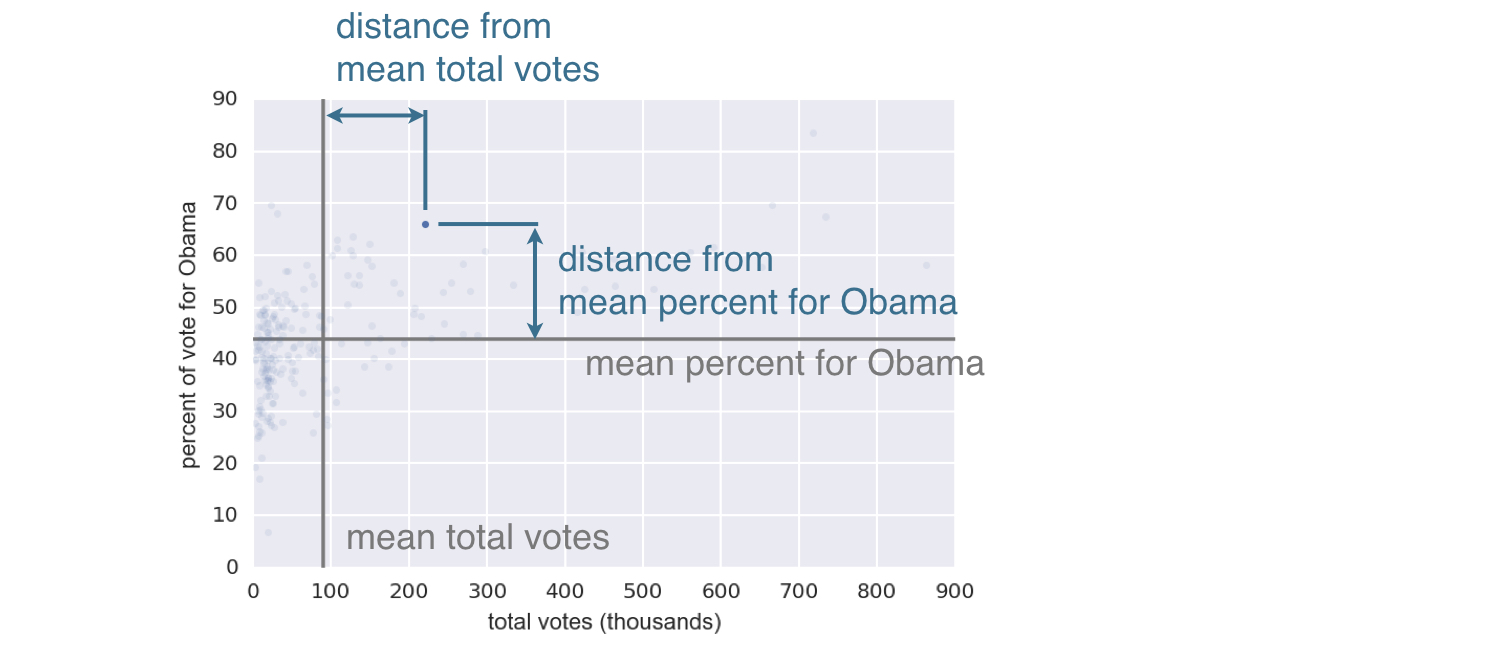
$$covariance = \frac{1}{n}\sum_{i=1}^{n}(x_i - \bar{x})(y_i - \bar{y})$$
1 Data retrieved from Data.gov (https://www.data.gov/)
피어슨 상관계수 예시