히스토그램 그리기

Python으로 하는 Statistical Thinking (파트 1)

Justin Bois

Teaching Professor at the California Institute of Technology

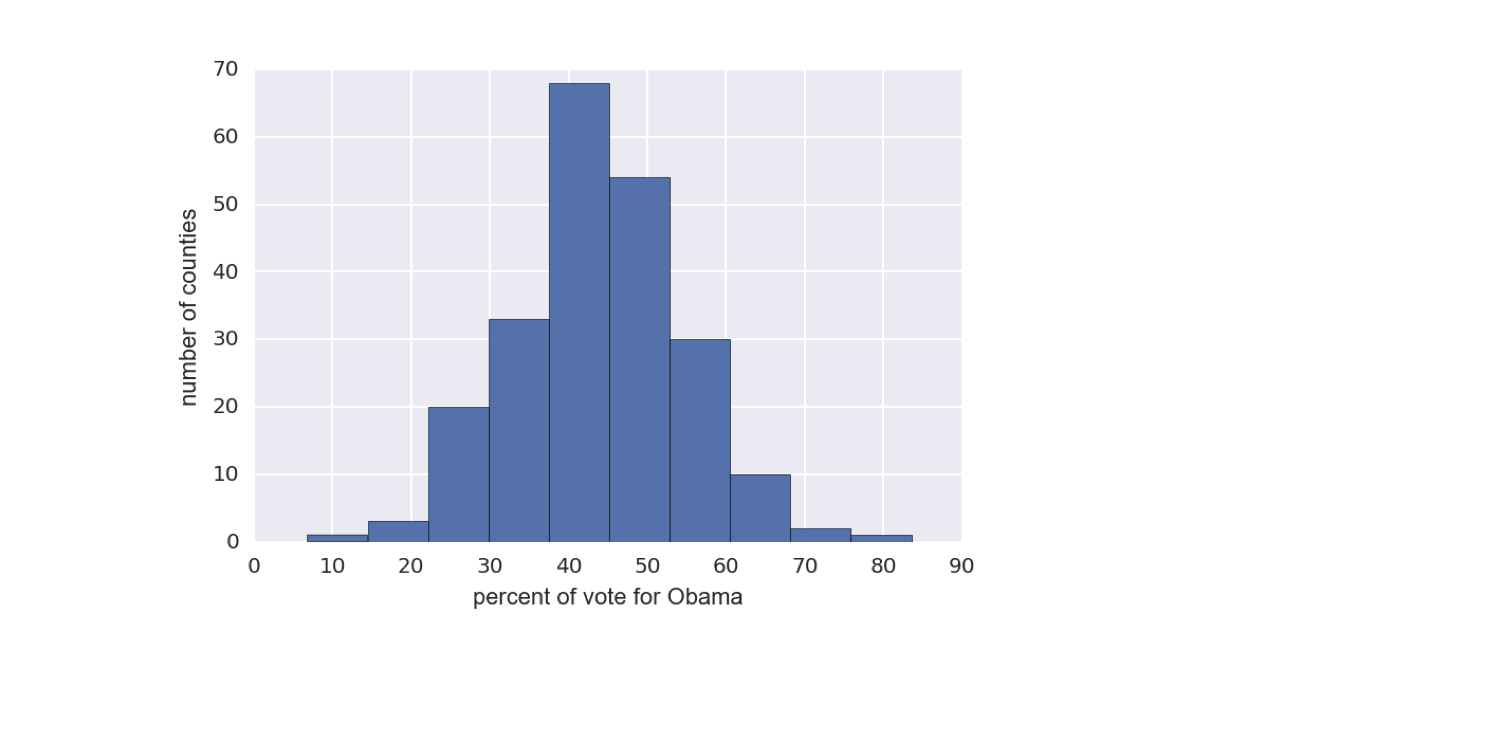
2008년 미국 스윙스테이트 선거 결과

데이터 출처: Data.gov (https://www.data.gov/)
ch1-2.003.png

Python으로 하는 Statistical Thinking (파트 1)

히스토그램 생성

import matplotlib.pyplot as plt
_ = plt.hist(df_swing['dem_share'])
_ = plt.xlabel('오바마 득표 비율(%)')
_ = plt.ylabel('카운티 수')
plt.show()
Python으로 하는 Statistical Thinking (파트 1)

축 라벨은 항상 표기

Python으로 하는 Statistical Thinking (파트 1)

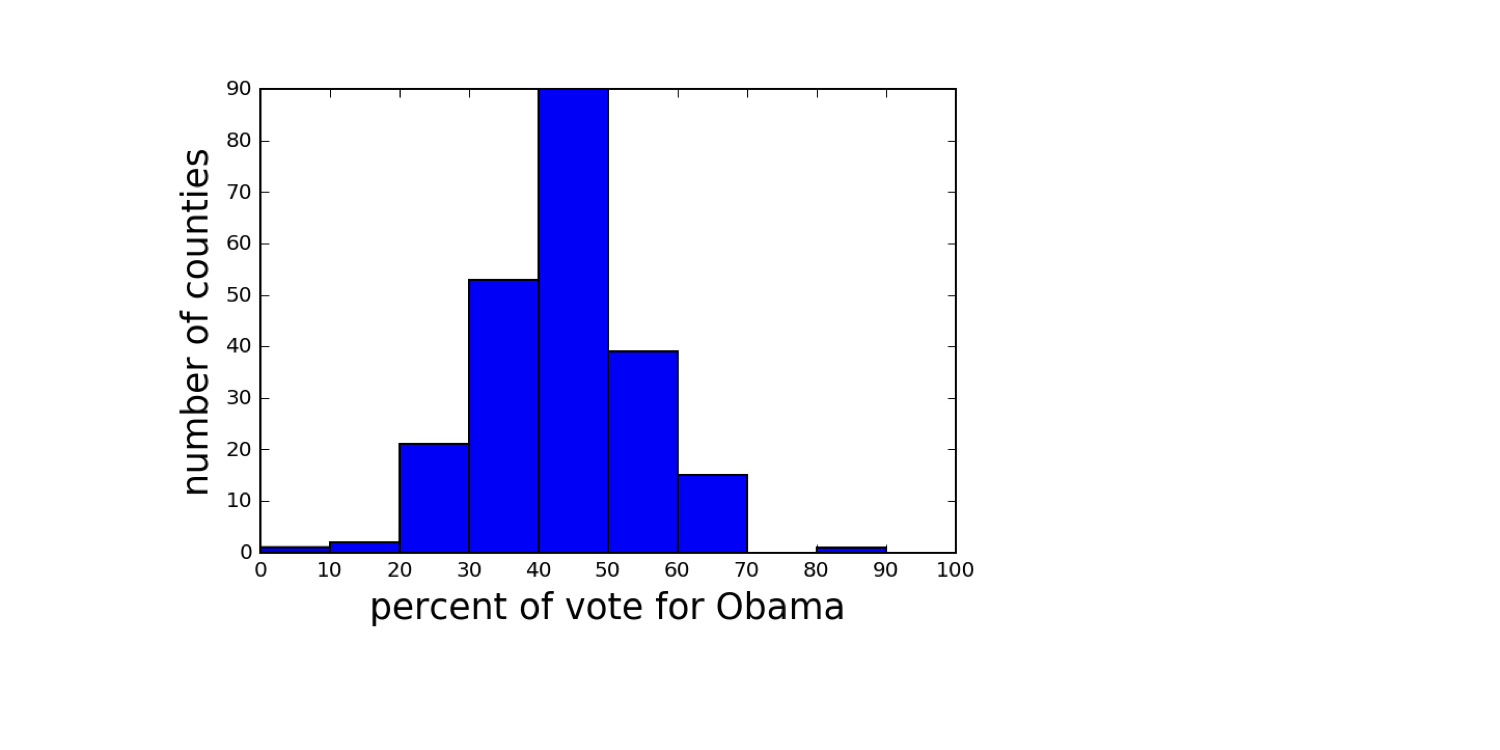
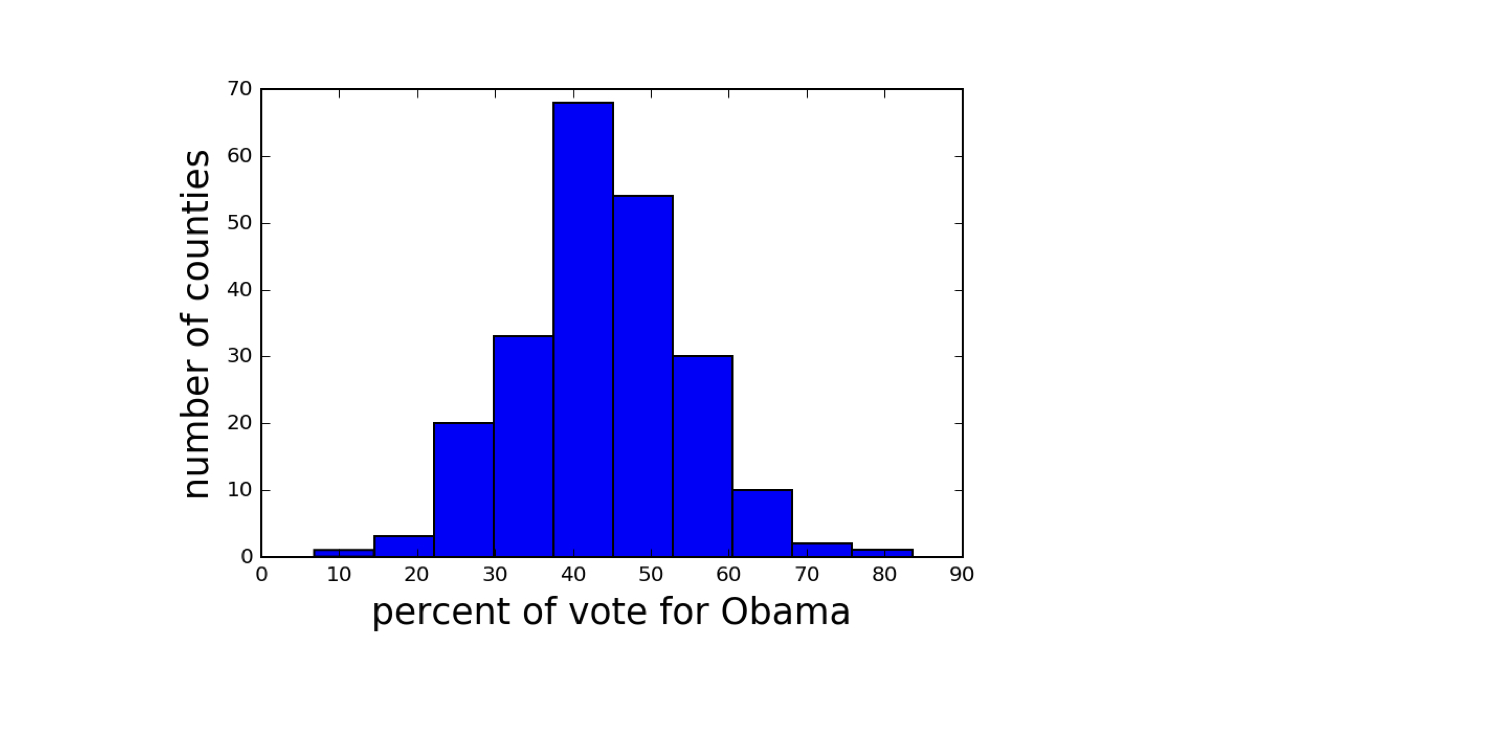
2008년 미국 스윙스테이트 선거 결과

데이터 출처: Data.gov (https://www.data.gov/)
ch1-2.013.png

Python으로 하는 Statistical Thinking (파트 1)

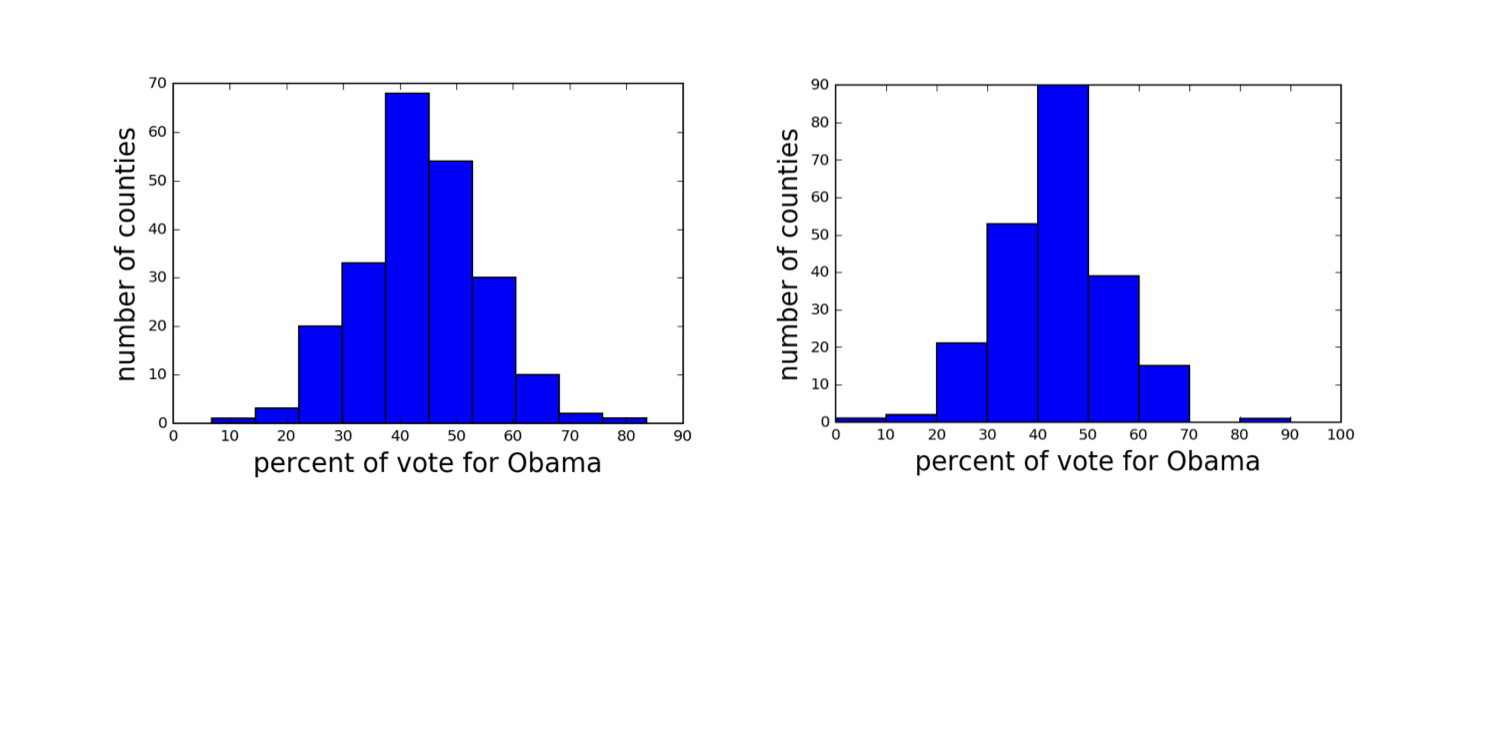
서로 다른 구간의 히스토그램

데이터 출처: Data.gov (https://www.data.gov/)
ch1-2.015.png

Python으로 하는 Statistical Thinking (파트 1)

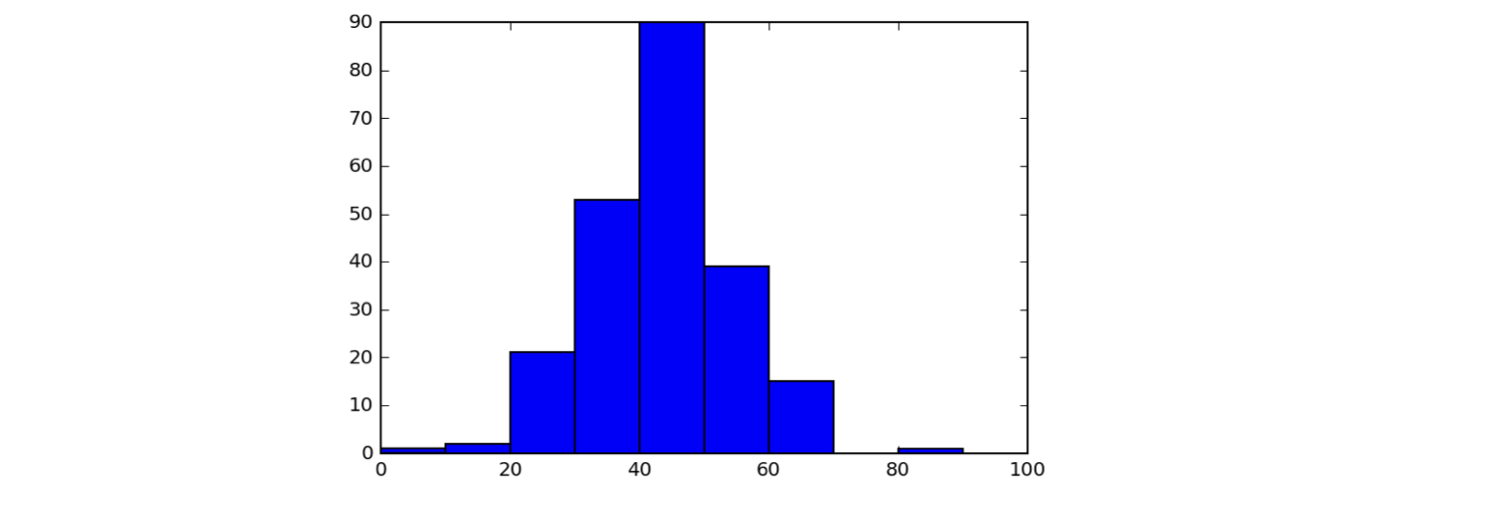
히스토그램의 구간(bin) 설정

bin_edges = [0, 10, 20, 30, 40, 50,
                60, 70, 80, 90, 100]
_ = plt.hist(df_swing['dem_share'], bins=bin_edges)
plt.show()
ch1-2.022.png

Python으로 하는 Statistical Thinking (파트 1)

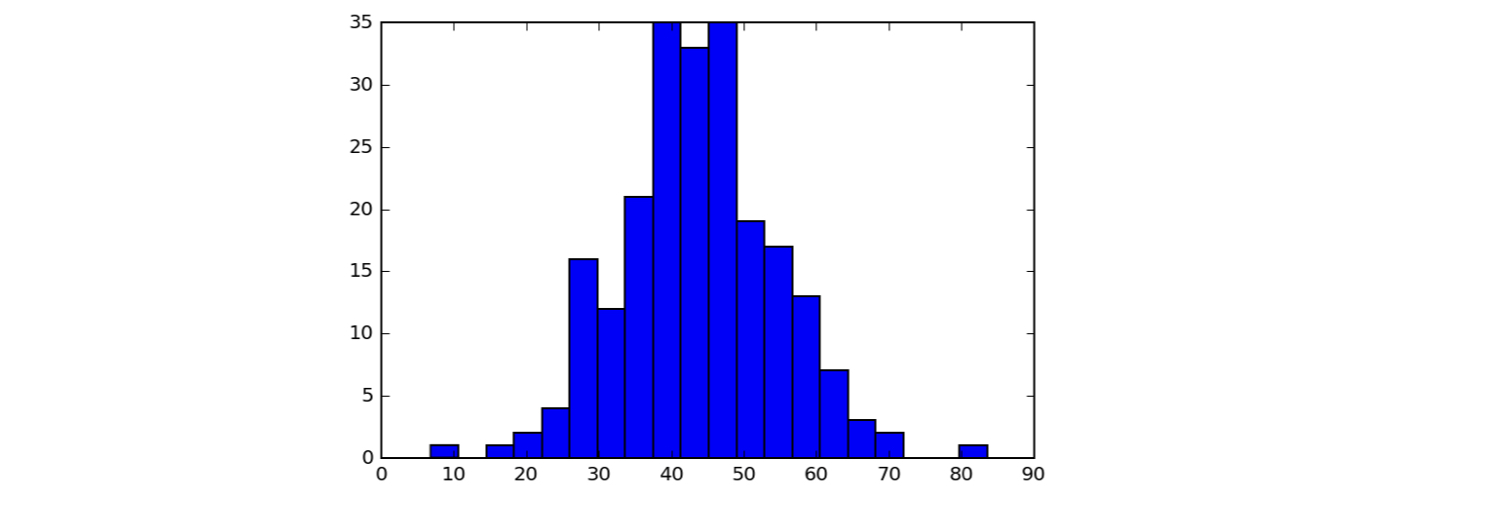
히스토그램의 구간(bin) 설정

_ = plt.hist(df_swing['dem_share'], bins=20)
plt.show()
ch1-2.027.png

Python으로 하는 Statistical Thinking (파트 1)

Seaborn

  • Michael Waskom이 개발한 Matplotlib 기반 통계 시각화 패키지
Python으로 하는 Statistical Thinking (파트 1)

Seaborn 스타일 설정

import seaborn as sns
sns.set()
_ = plt.hist(df_swing['dem_share'])
_ = plt.xlabel('오바마 득표 비율(%)')
_ = plt.ylabel('카운티 수')
plt.show()
Python으로 하는 Statistical Thinking (파트 1)

Seaborn 스타일의 히스토그램

ch1-2.038.png

1 데이터 출처: Data.gov (https://www.data.gov/)
Python으로 하는 Statistical Thinking (파트 1)

연습해 봅시다!

Python으로 하는 Statistical Thinking (파트 1)

Preparing Video For Download...