Dash와 Plotly로 대시보드 만들기
Alex Scriven
Data Scientist
html.Table는 정적 → 기능 제한적$$
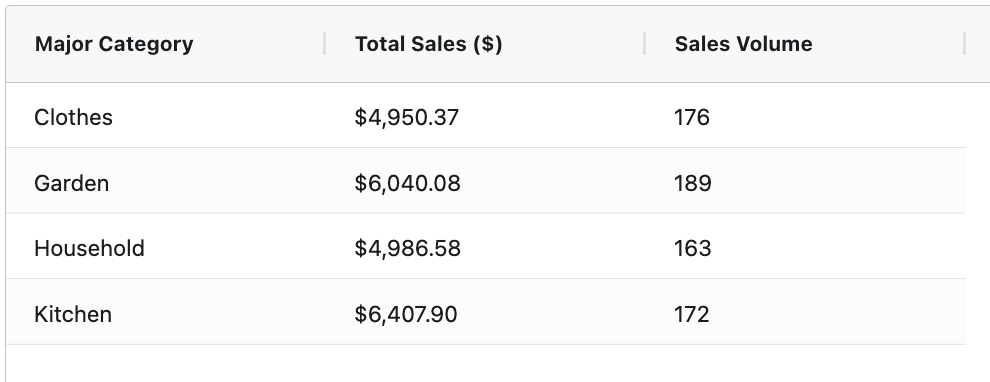
from dash_ag_grid import AgGridcolumn_defs = [ {"field": "Major Category"}, {"field": "Total Sales ($)"}, {"field": "Sales Volume"}, ]
grid = AgGrid( columnDefs=column_defs,rowData=major_cat_tb.to_dict("records"))app.layout = [grid]
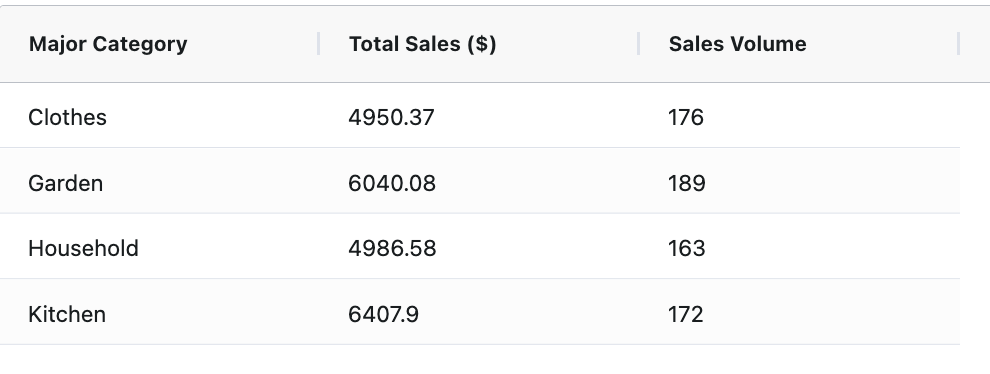
valueFormatter 사용money_fmt = { "function": ( """params.value.toLocaleString( 'en-US', {style: 'currency', currency: 'USD'})""" )}column_defs = [ {"field": "Major Category"}, {"field": "Total Sales ($)", "valueFormatter": money_fmt}, {"field": "Sales Volume"} ] # 이전과 같이 레이아웃에 추가

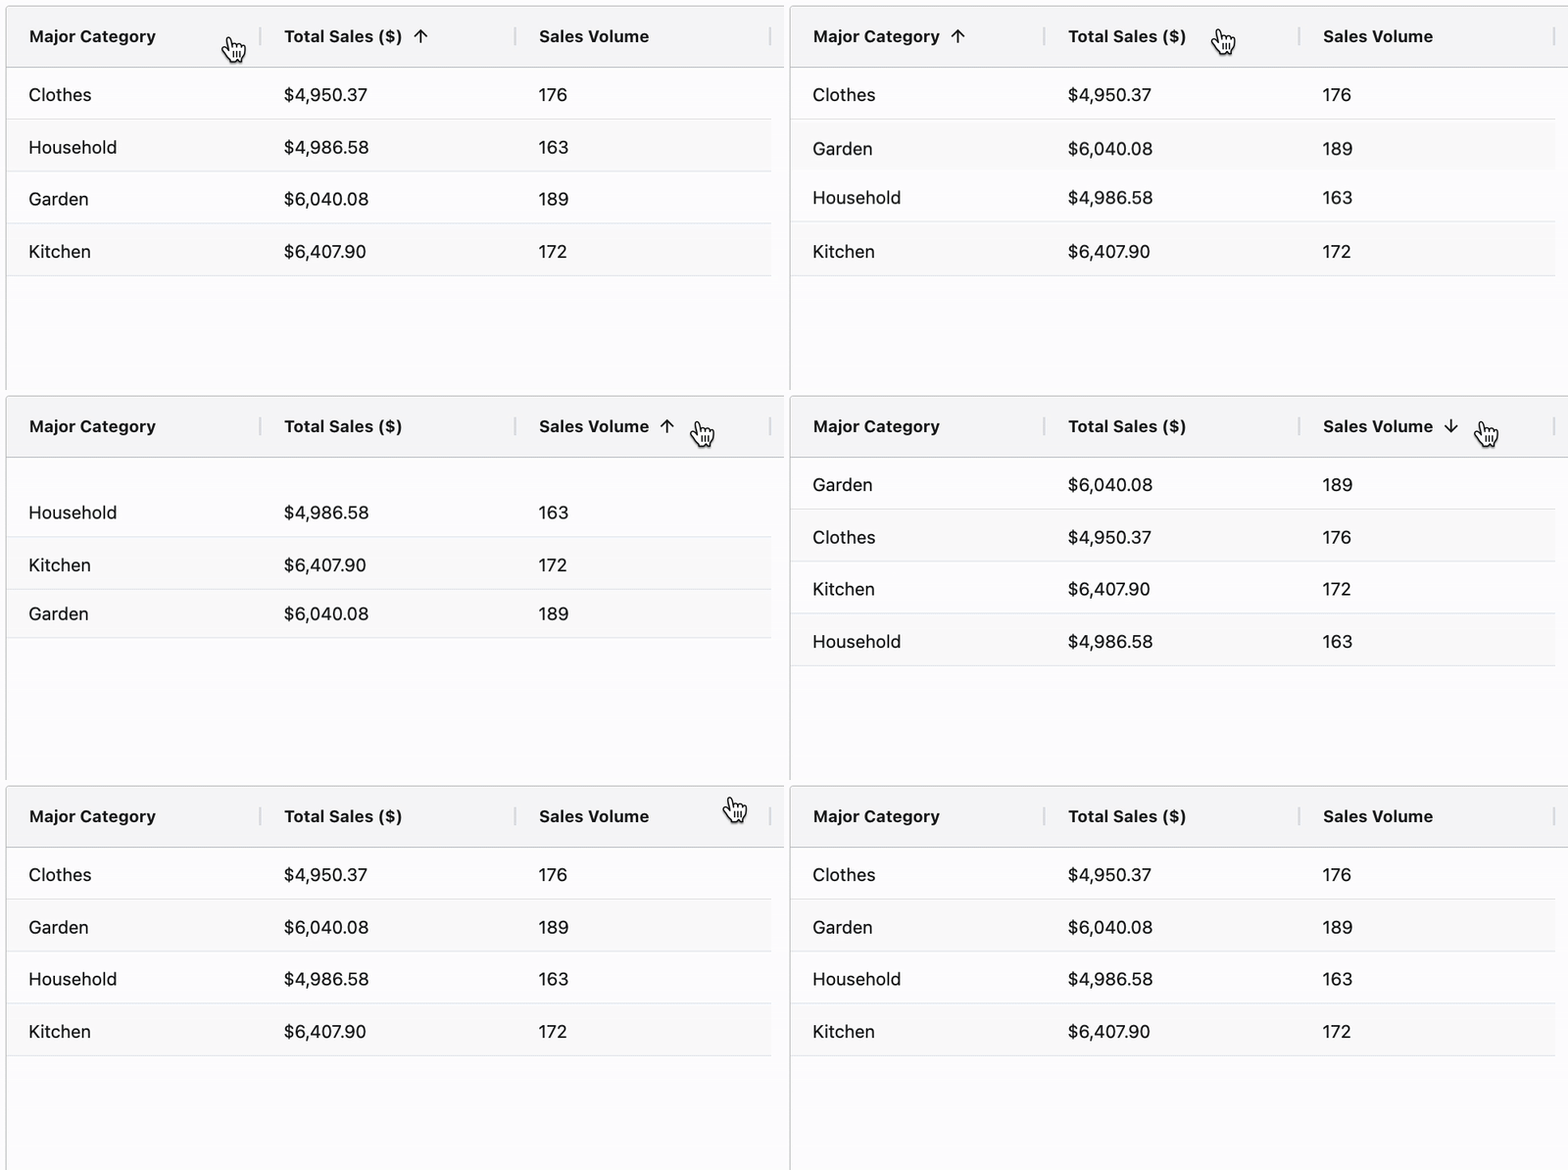
# 전역 비활성화 grid = AgGrid( defaultColDef={"sortable": False} )# 열별 지정 column_defs = [ {"field": "Major Category" , "sortable": True}, # 켜기 {"field": "Sales Volume" , "sortable": False} # 끄기 ]
$$

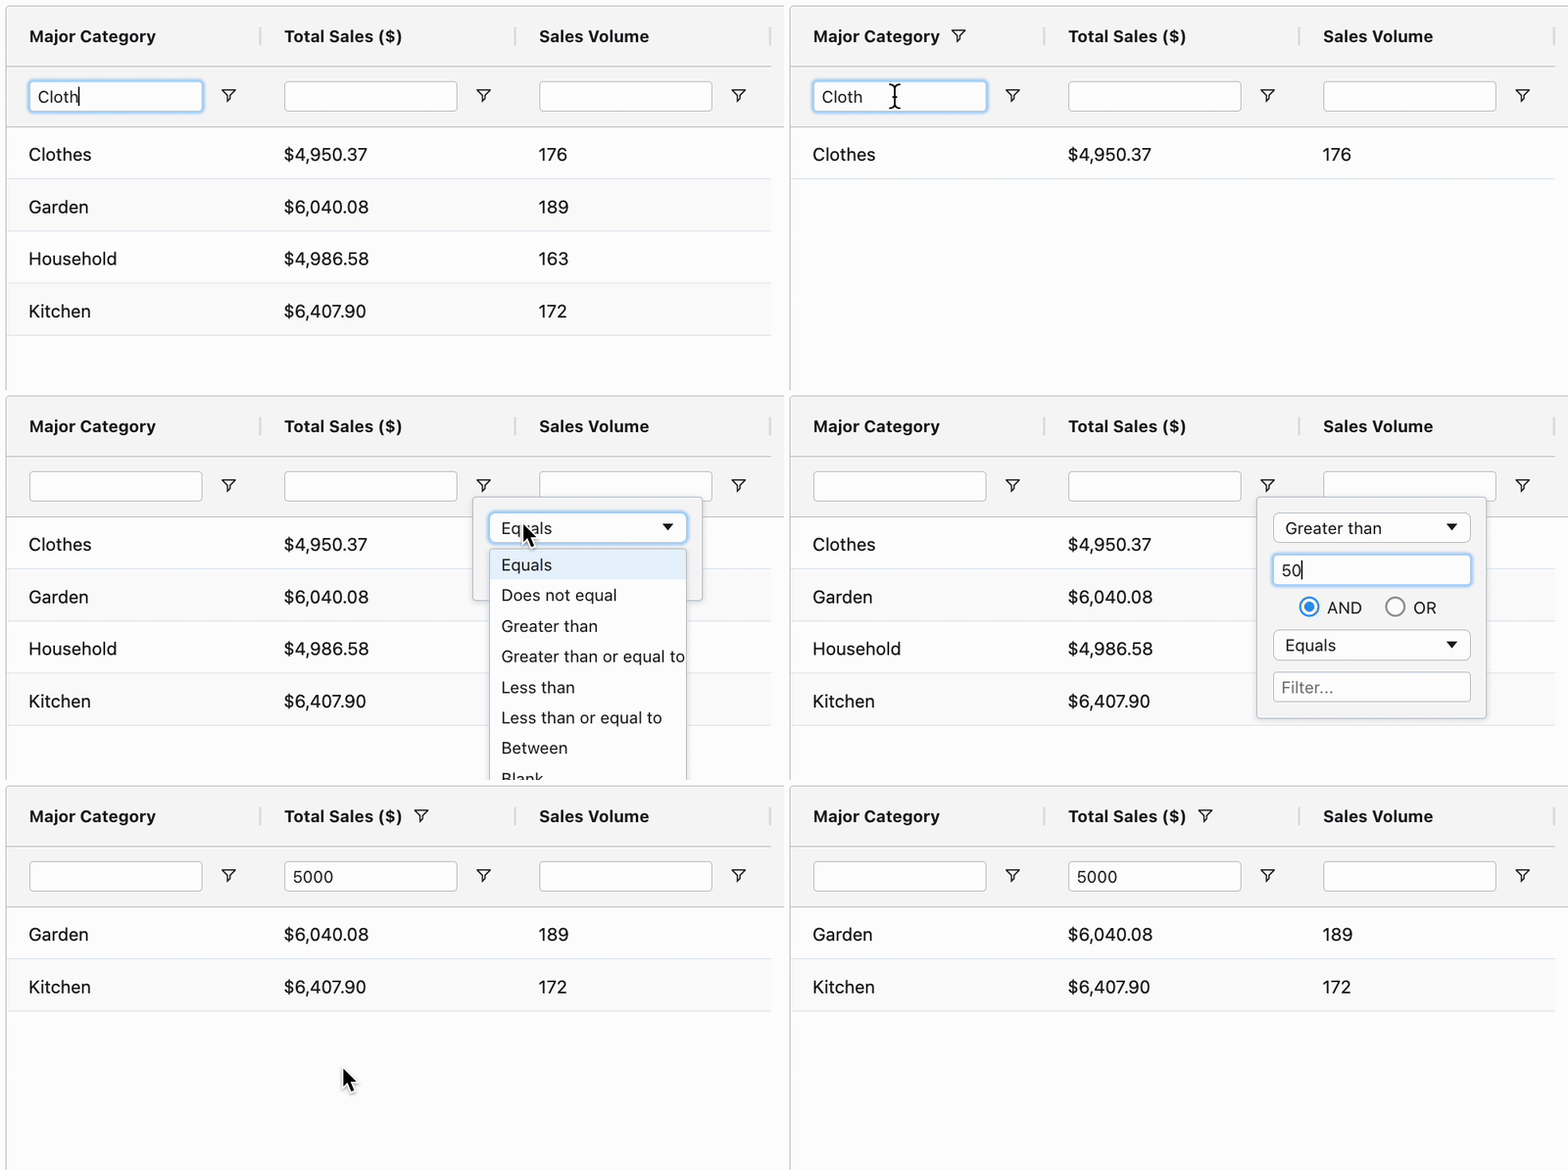
grid = AgGrid(
defaultColDef={
"filter": True
, "floatingFilter": True}
)
$$
$$

$$
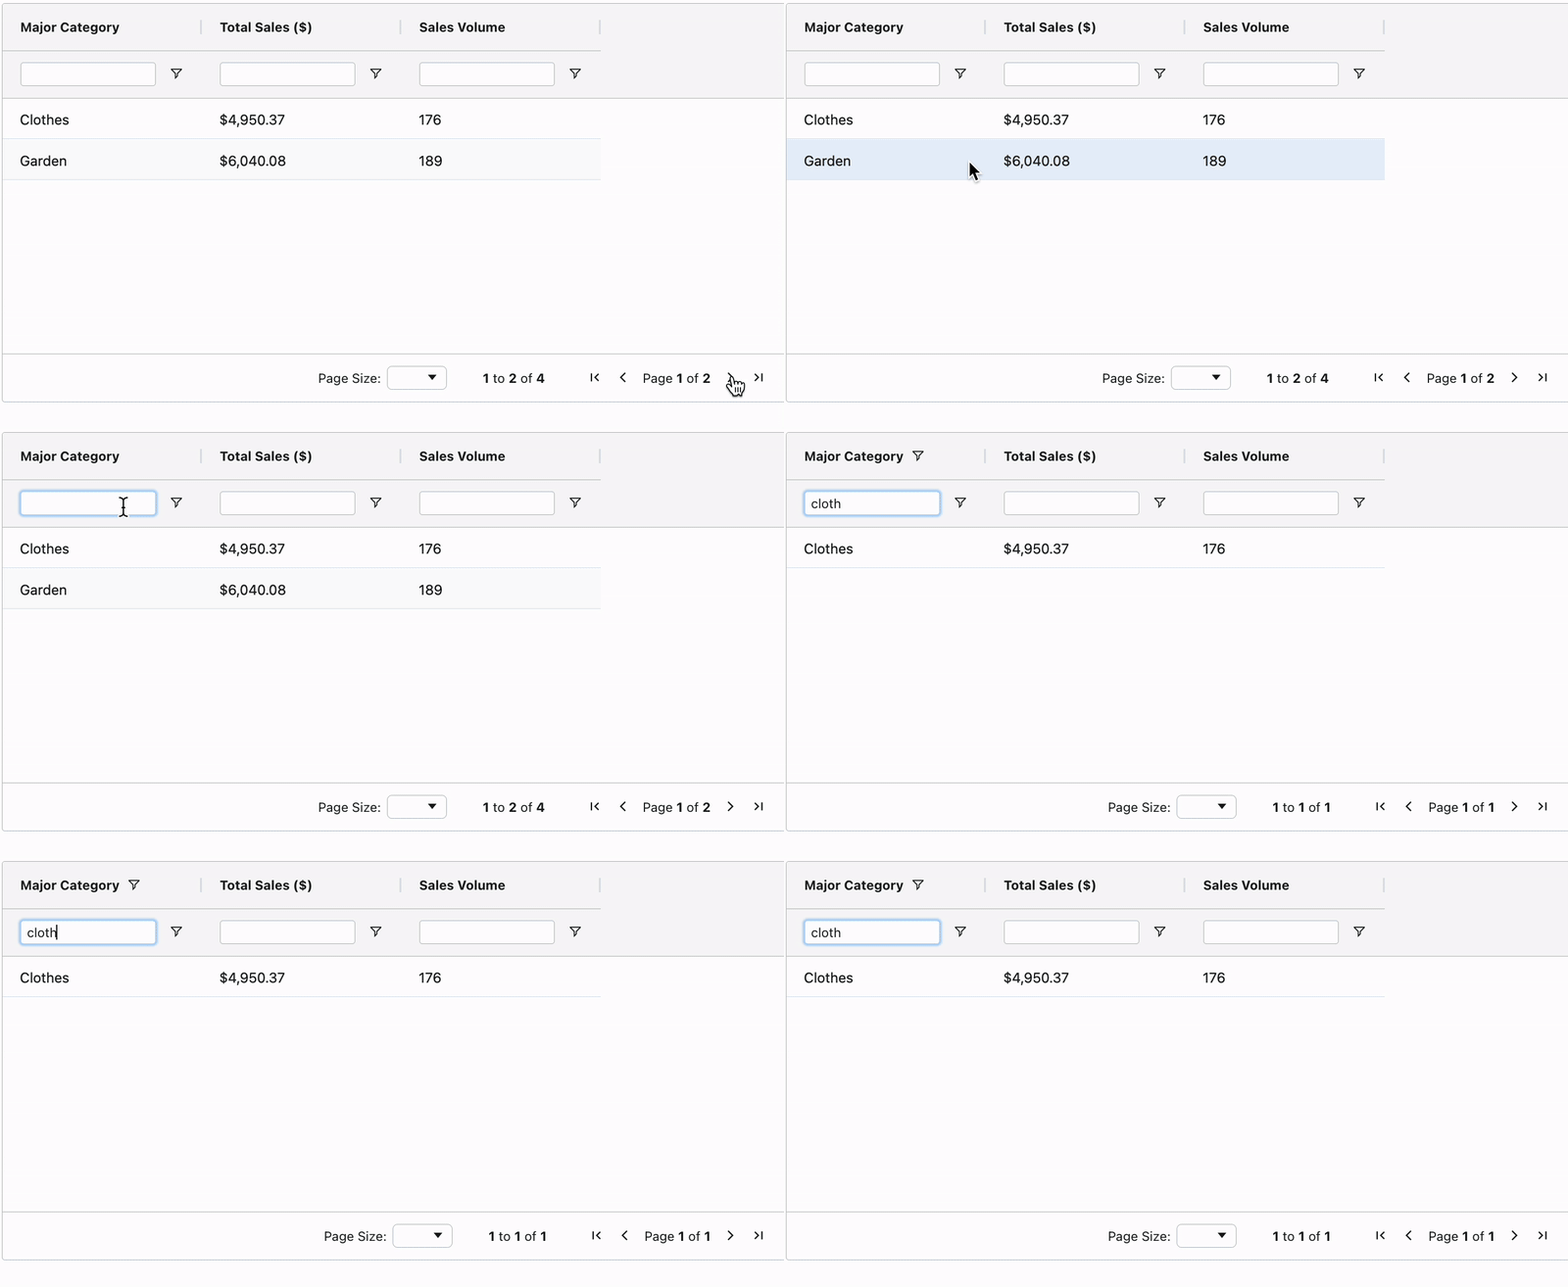
grid = AgGrid(
dashGridOptions={
"pagination": True,
"paginationPageSize": 2
}
$$

Dash와 Plotly로 대시보드 만들기