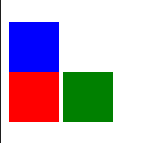
Dash의 고급 CSS
Dash와 Plotly로 대시보드 만들기

Alex Scriven
Data Scientist
객체 간 간격을 위한 CSS
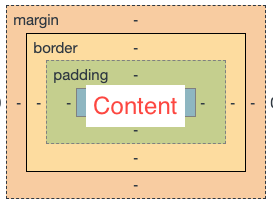
'박스 모델'은 각 HTML 요소를 여러 층의 상자로 봅니다:
- 객체 내용(
height,width속성) - 패딩(내용 밖)
- 테두리(패딩과 마진 사이)
- 마진(테두리 밖, 요소 간 간격)
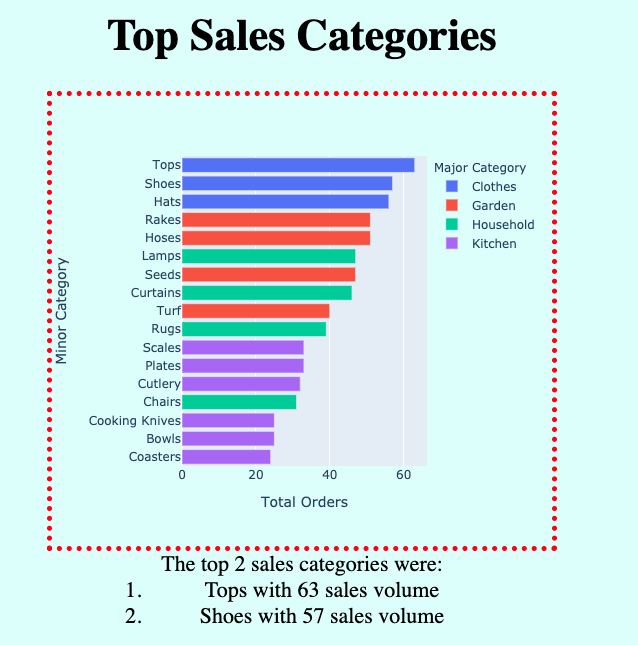
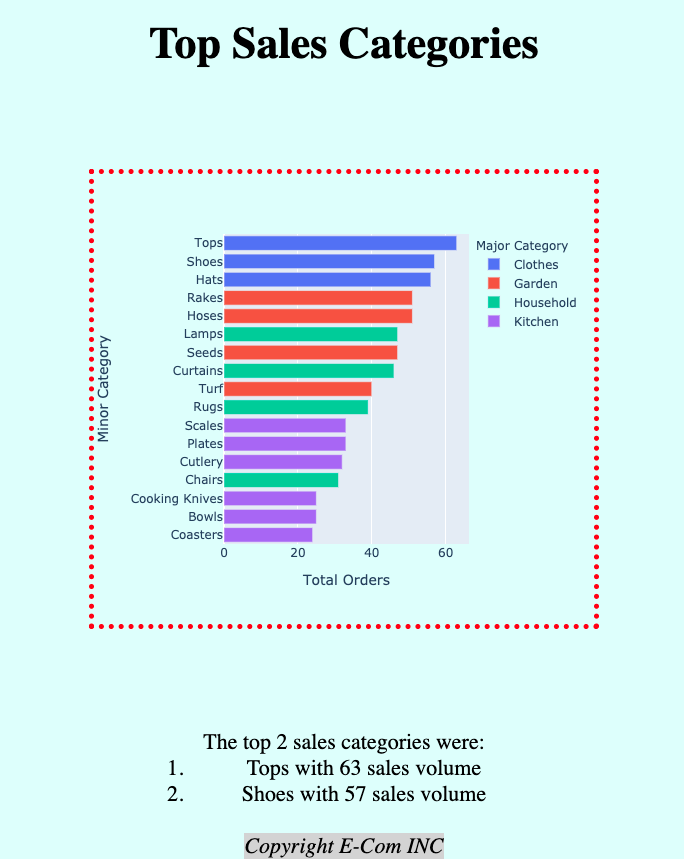
앱에 테두리 추가
CSS 간격 설정
$$
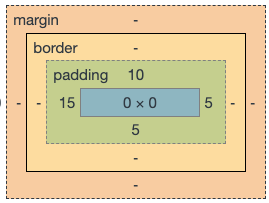
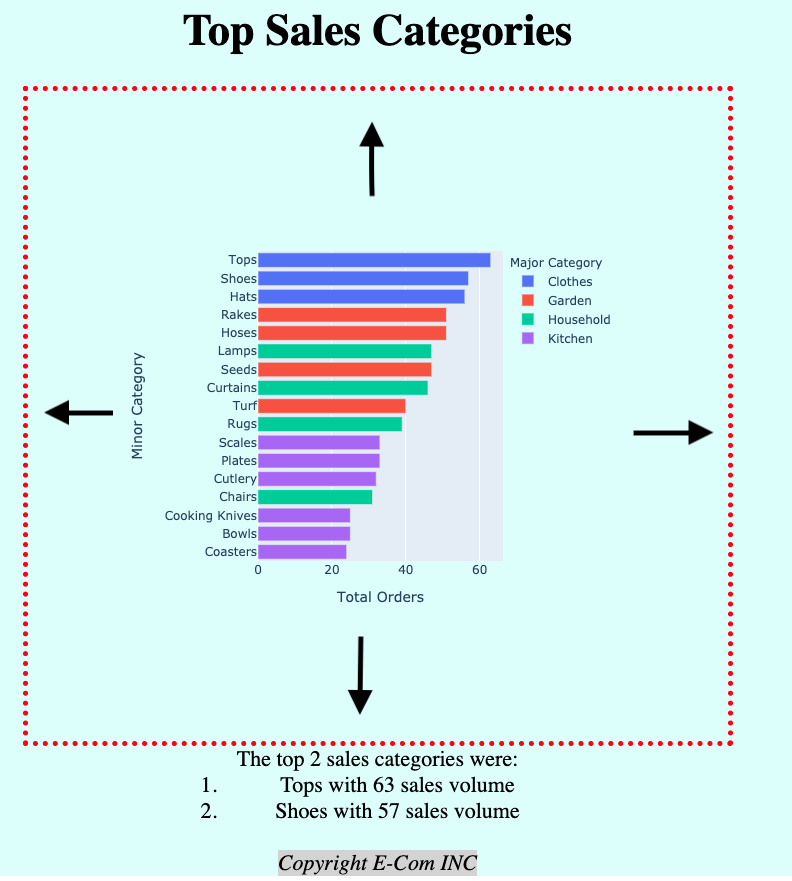
Dash에서 패딩 추가
패딩 없음:
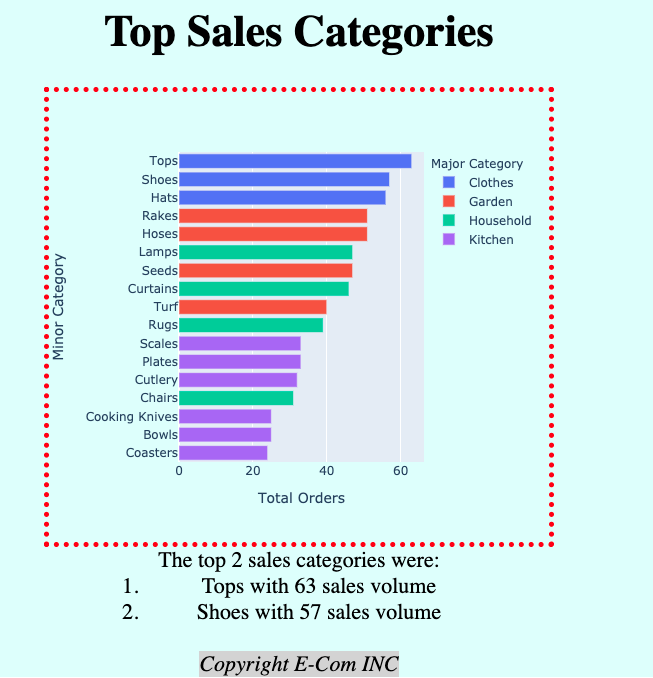
'padding':'100px' 추가:
Dash에서 마진 추가
마진 없음:
margin: 100px auto 추가:
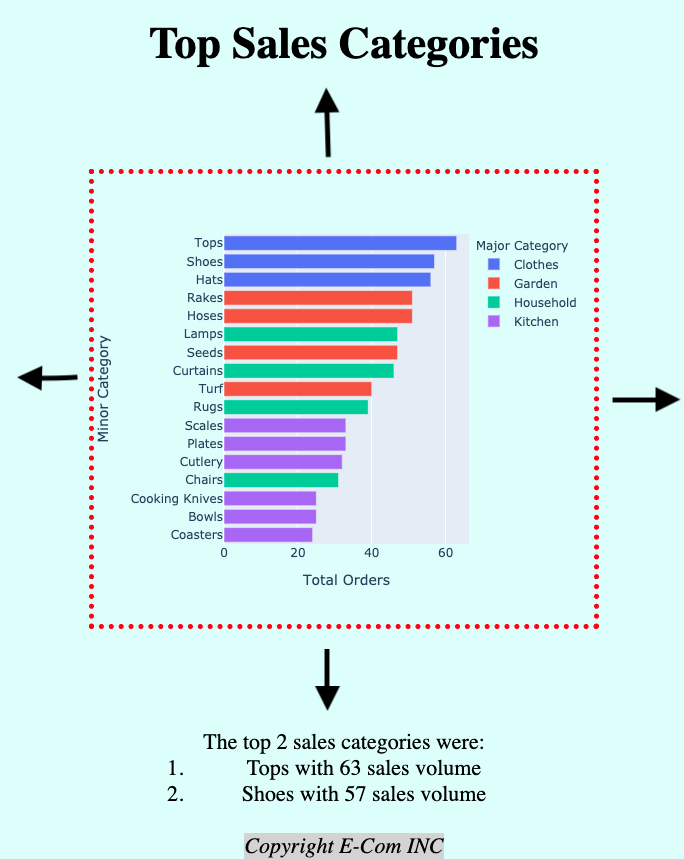
auto 마진으로 중앙 정렬
'margin':'100px' 사용:
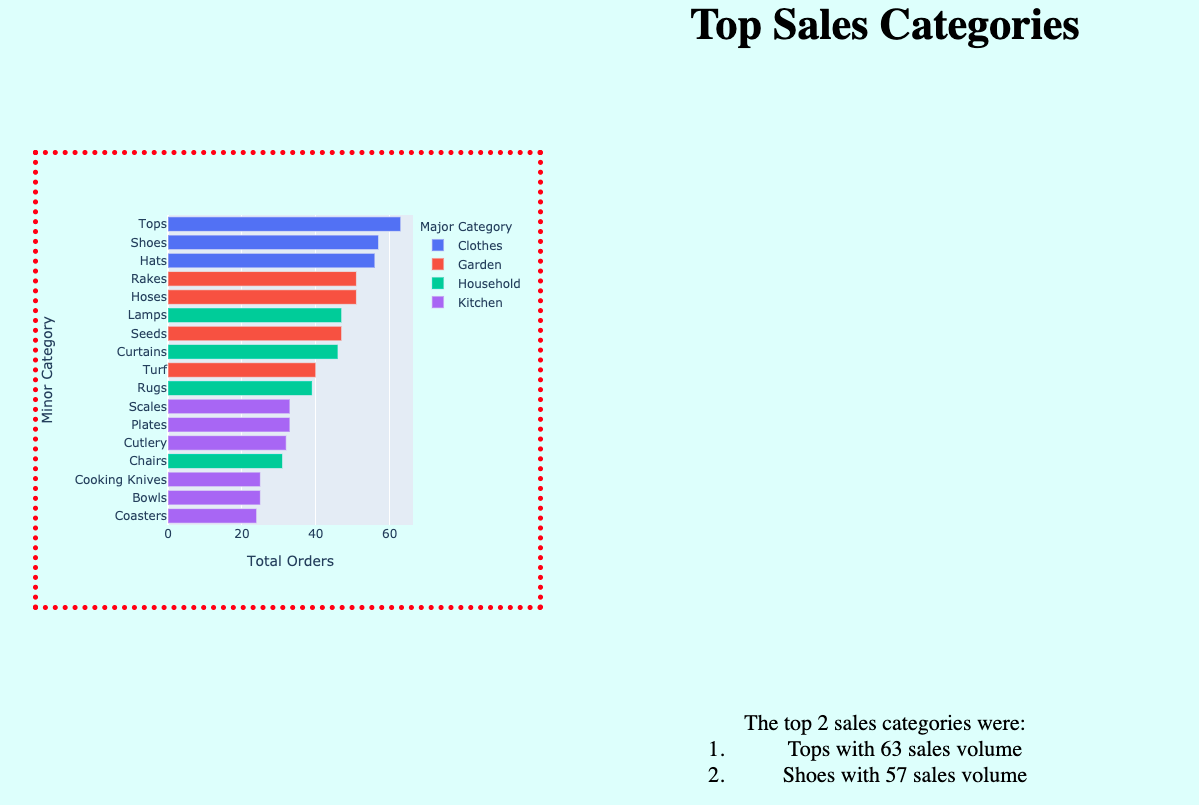
'margin':'100px auto' 사용:
inline-block 요소
$$