Scikit-Learn의 랜덤 서치
Python에서의 하이퍼파라미터 튜닝

Alex Scriven
Data Scientist
GridSearchCV와 비교
바퀴를 다시 만들 필요는 없습니다. Grid Search 절차를 떠올려 봅시다:
- 알고리즘/추정기 결정
- 튜닝할 하이퍼파라미터 결정
- 각 하이퍼파라미터의 값 범위 결정
- 교차검증 방식 설정
- 평가지표 정의
- 유용한 추가 정보/함수 포함
Grid Search와 비교
차이는 단 하나입니다:
- 7단계 = 샘플 개수 결정(그리고 샘플링)
이것으로 충분합니다! (대부분)
Scikit-Learn 모듈 비교
모듈도 유사합니다:
GridSearchCV:
sklearn.model_selection.GridSearchCV(estimator, param_grid,
        scoring=None, fit_params=None,
        n_jobs=None,
        refit=True, cv='warn', verbose=0,
        pre_dispatch='2*n_jobs',
        error_score='raise-deprecating',
        return_train_score='warn')
RandomizedSearchCV:
sklearn.model_selection.RandomizedSearchCV(estimator,
        param_distributions, n_iter=10,
        scoring=None, fit_params=None,
        n_jobs=None, refit=True,
        cv='warn', verbose=0,
        pre_dispatch='2*n_jobs',
        random_state=None,
        error_score='raise-deprecating',
        return_train_score='warn')
핵심 차이점
두 가지 핵심 차이:
n_iter: 그리드에서 랜덤 서치가 뽑을 샘플 수. 앞 예시에서는 300을 사용했습니다.param_distributions:param_grid와 유사하지만, 샘플링 분포를 선택적으로 지정할 수 있습니다.- 기본값은 모든 조합이 동일한 확률로 선택됩니다.
RandomizedSearchCV 객체 만들기
이제 그리드 서치와 거의 동일하게 랜덤 서치 객체를 만들 수 있습니다. 단, 이 한 가지 변경만 적용합니다:
# Set up the sample space learn_rate_list = np.linspace(0.001,2,150) min_samples_leaf_list = list(range(1,51)) # Create the grid parameter_grid = { 'learning_rate' : learn_rate_list, 'min_samples_leaf' : min_samples_leaf_list}# Define how many samples number_models = 10
RandomizedSearchCV 객체 만들기
이제 객체를 생성합니다
# Create a random search object
random_GBM_class = RandomizedSearchCV(
    estimator = GradientBoostingClassifier(),
    param_distributions = parameter_grid,
    n_iter = number_models,
    scoring='accuracy',
    n_jobs=4,
    cv = 10,
    refit=True,
    return_train_score = True)
# Fit the object to our data
random_GBM_class.fit(X_train, y_train)
출력 분석
출력은 완전히 동일합니다!
선택된 하이퍼파라미터 값은 어디서 확인하나요?
cv_results_ 딕셔너리의 관련 param_ 열에서 확인합니다!
리스트를 추출합니다:
rand_x = list(random_GBM_class.cv_results_['param_learning_rate'])
rand_y = list(random_GBM_class.cv_results_['param_min_samples_leaf'])
출력 분석
시각화를 만듭니다:
# Make sure we set the limits of Y and X appriately x_lims = [np.min(learn_rate_list), np.max(learn_rate_list)] y_lims = [np.min(min_samples_leaf_list), np.max(min_samples_leaf_list)]# Plot grid results plt.scatter(rand_y, rand_x, c=['blue']*10) plt.gca().set(xlabel='learn_rate', ylabel='min_samples_leaf', title='Random Search Hyperparameters') plt.show()
출력 분석
앞과 유사한 그래프:
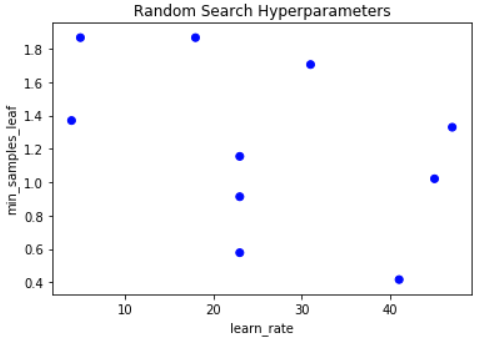
연습해 봅시다!
Python에서의 하이퍼파라미터 튜닝

