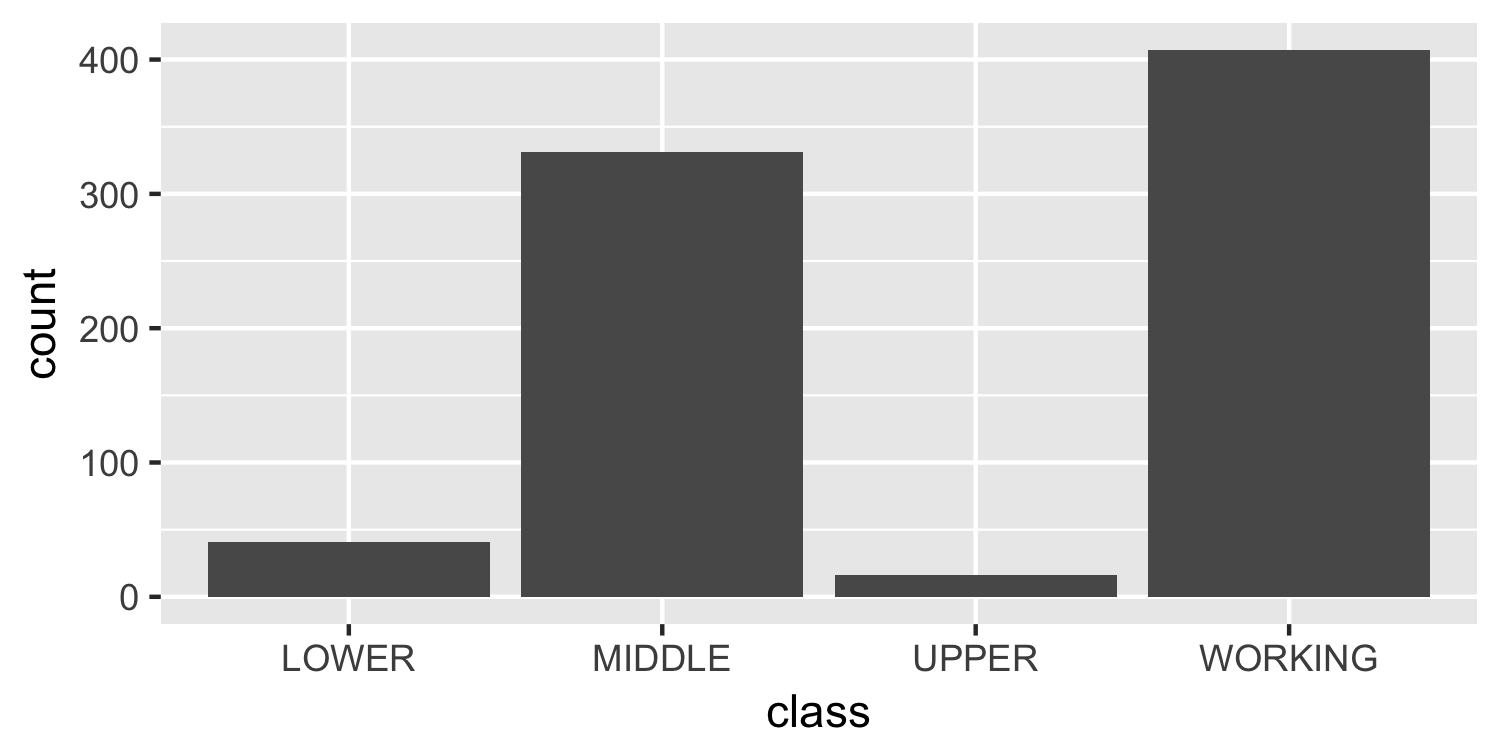
Inference for Numerical Data in R
Mine Cetinkaya-Rundel
Associate Professor of the Practice, Duke University
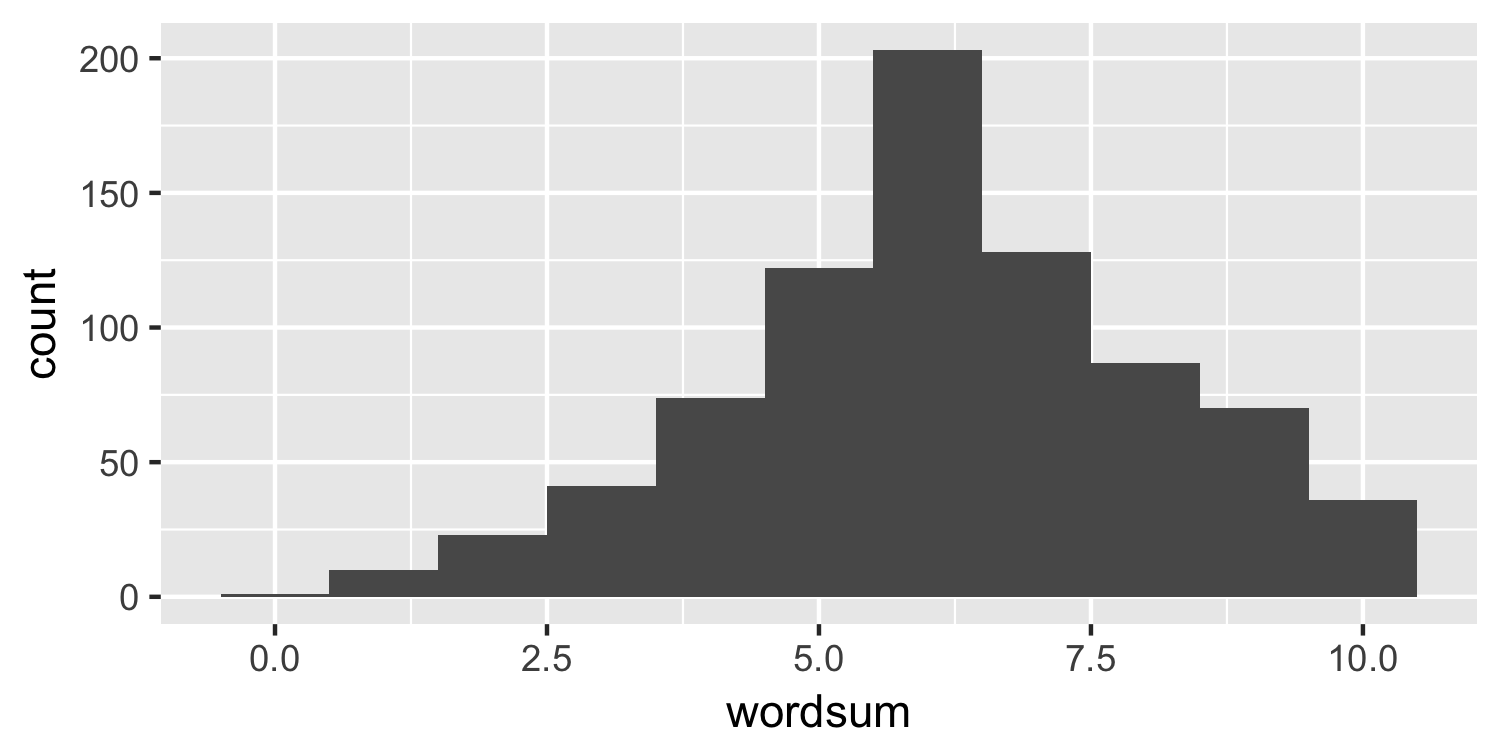
wordsum
: 10 question vocabulary test (scores range from 0 to 10)class
: self identified social class (lower, working, middle, upper) wordsum class
1 6 MIDDLE
2 9 WORKING
3 6 WORKING
4 5 WORKING
5 6 WORKING
6 6 WORKING
... ... ...
795 9 MIDDLE
ggplot(data = gss, aes(x = wordsum)) +
geom_histogram(binwidth = 1)
If you were asked to use one of four names for your social class, which would you say you belong in: the lower class, the working class, the middle class, or the upper class?
ggplot(data = gss, aes(x = wordsum)) +
geom_histogram(binwidth = 1)
Inference for Numerical Data in R