ANOVA

Inference for Numerical Data in R

Mine Cetinkaya-Rundel

Associate Professor of the Practice, Duke University
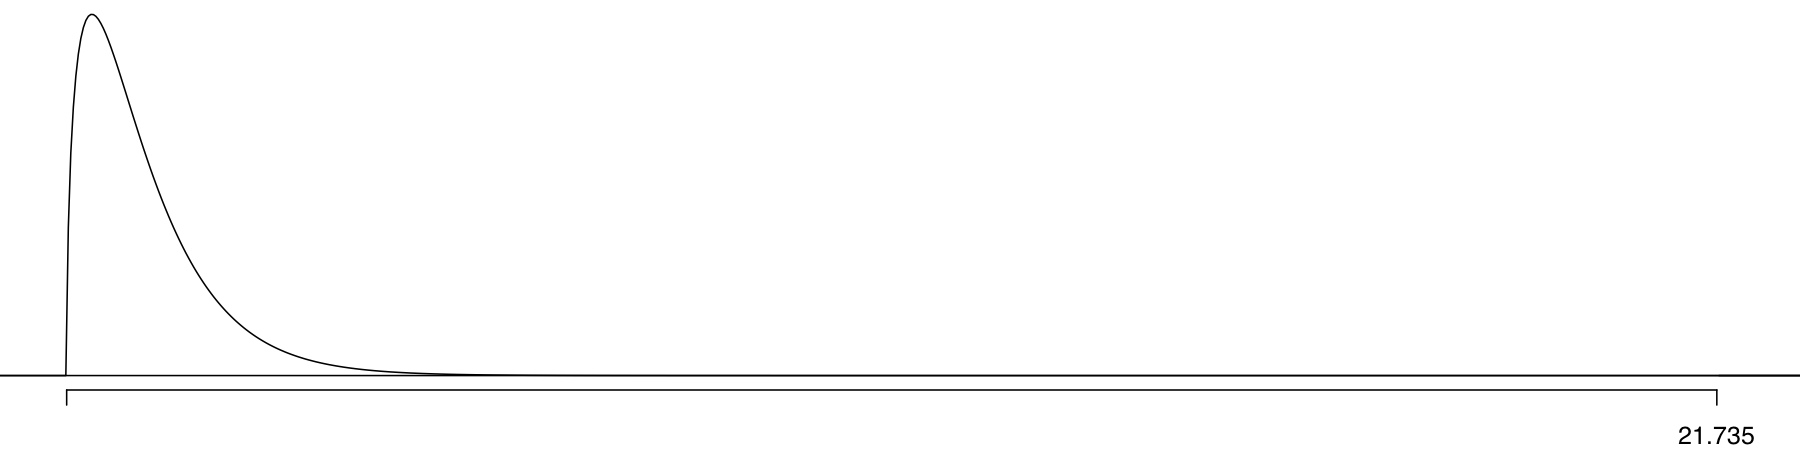
Runners

Inference for Numerical Data in R

ANOVA for vocabulary scores vs. self identified social class

$H_0$: The average vocabulary score is the same across all social classes, $\mu_{lower} = \mu_{working} = \mu_{middle} = \mu_{upper}$.

$H_A$: The average vocabulary scores differ between at least one pair of social classes.

Inference for Numerical Data in R

Variability partitioning

Total variability in vocabulary score:

  • Variability that can be attributed to differences in social class - between group variability
  • Variability attributed to all other factor - within group variability
Inference for Numerical Data in R

ANOVA output

library(broom)

aov(wordsum ~ class, gss) %>%
  tidy()
term        df     sumsq    meansq   statistic p.value
class        3   236.5644  78.854810  21.73467       0
Residuals  791  2869.8003   3.628066        NA      NA
Inference for Numerical Data in R

Sum of squares

term        df     sumsq    meansq   statistic p.value
class        3   236.5644  78.854810  21.73467       0
Residuals  791  2869.8003   3.628066        NA      NA
  • $SST = 236.5644 + 2869.8003 = 3106.365$ - Measures the total variability in the response variable
  • Calculated very similarly to variance (except not scaled by the sample size)
  • Percentage of explained variability = $\frac{236.5644}{3106.365} = 7.6\%$
Inference for Numerical Data in R

F-statistic

term        df     sumsq    meansq   statistic p.value
class        3   236.5644  78.854810  21.73467       0
Residuals  791  2869.8003   3.628066        NA      NA

F-statistic = 21.73467 = $\frac{between~group~var}{within~group~var}$

F-statistic and p-value

Inference for Numerical Data in R

Let's practice!

Inference for Numerical Data in R

Preparing Video For Download...