t-interval for paired data
Inference for Numerical Data in R

Mine Cetinkaya-Rundel
Associate Professor of the Practice, Duke University
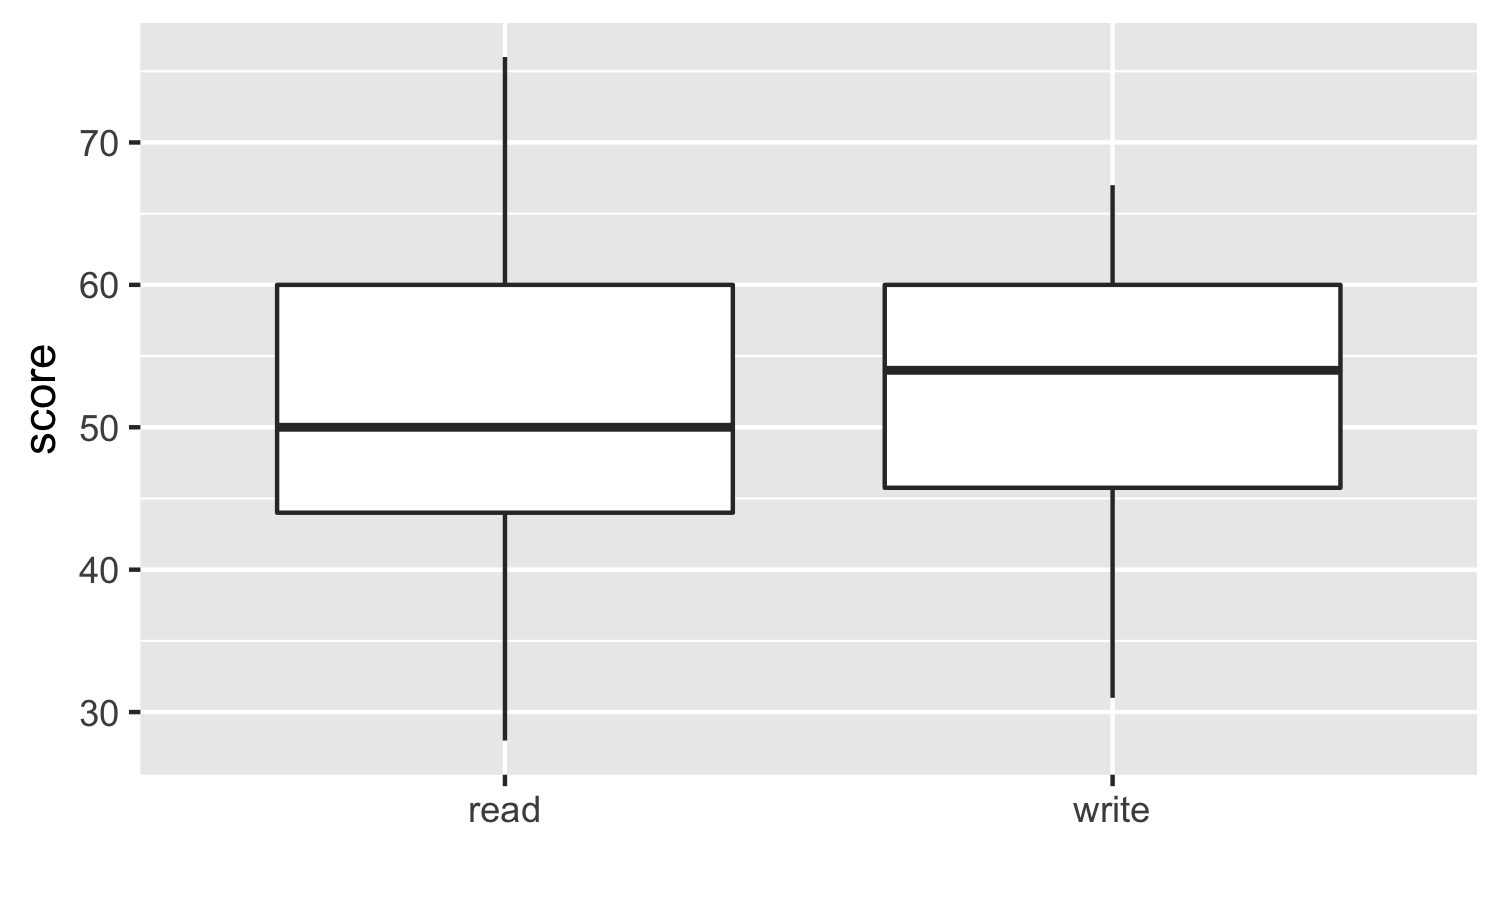
High School and Beyond
Inference for Numerical Data in R
Mine Cetinkaya-Rundel
Associate Professor of the Practice, Duke University

