모멘텀 지표: RSI

Python으로 배우는 금융 트레이딩

Chelsea Yang

Data Science Instructor

RSI란?

  • "Relative Strength Index"의 약자
  • J. Welles Wilder 개발
    • "New Concepts in Technical Systems" (1987)
  • 추세의 모멘텀을 측정
    • 0~100 사이에서 진동
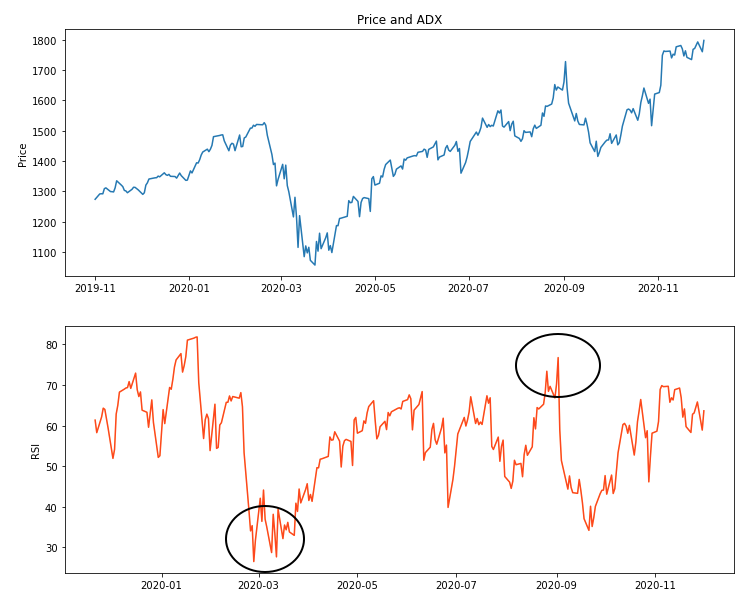
    • RSI > 70: 과매수
    • RSI < 30: 과매도
Python으로 배우는 금융 트레이딩

RSI 계산 방법

$ RSI = 100 - 100/(1+RS) $

정의:

  • RS: 상대 강도
  • RS = 상승 가격 변화의 평균 / 하락 가격 변화의 평균
Python으로 배우는 금융 트레이딩

Python으로 RSI 구현

# Calculate RSI
stock_data['RSI'] = talib.RSI(stock_data['Close'], timeperiod=14)

# Print the last five rows print(stock_data.tail())
              Open    High     Low   Close   RSI
Date                                            
2020-11-24 1730.50 1771.60 1727.69 1768.88 62.78
2020-11-25 1772.89 1778.54 1756.54 1771.43 63.10
2020-11-27 1773.09 1804.00 1772.44 1793.19 65.81
2020-11-30 1781.18 1788.06 1755.00 1760.74 58.87
2020-12-01 1774.37 1824.83 1769.37 1798.10 63.63
Python으로 배우는 금융 트레이딩

RSI 시각화

import matplotlib.pyplot as plt

# Create subplots
fig, (ax1, ax2) = plt.subplots(2)

# Plot RSI with the price ax1.set_ylabel('Price') ax1.plot(stock_data['Close']) ax2.set_ylabel('RSI') ax2.plot(stock_data['RSI']) ax1.set_title('Price and RSI') plt.show()

위에는 종가 차트, 아래에는 RSI 차트가 있는 플롯

Python으로 배우는 금융 트레이딩

연습해 봅시다!

Python으로 배우는 금융 트레이딩

Preparing Video For Download...