추세 지표 MA

Python으로 배우는 금융 트레이딩

Chelsea Yang

Data Science Instructor

기술적 지표란?

  • 과거 시장 데이터에 기반한 수학적 계산
  • 시장은 효율적이며 가격이 모든 공개 정보를 반영한다고 가정
  • 과거 가격 패턴에 대한 통찰 제공
Python으로 배우는 금융 트레이딩

지표의 종류

  • 추세 지표: 추세의 방향·강도 측정
    • 예: 이동평균(MA), ADX
  • 모멘텀 지표: 가격 움직임의 속도 측정
    • 예: RSI
  • 변동성 지표: 가격 편차의 크기 측정
    • 예: 볼린저 밴드
Python으로 배우는 금융 트레이딩

TA-Lib 패키지

TA-Lib: Technical Analysis Library

  • 150+ 기술적 지표 구현 포함
import talib
Python으로 배우는 금융 트레이딩

이동평균 지표

  • SMA: 단순이동평균
  • EMA: 지수이동평균


  • 특징:
    • 가격과 함께 이동
    • 데이터를 평활화하여 방향을 더 명확히 표시
Python으로 배우는 금융 트레이딩

단순이동평균(SMA)

$ SMA = (P_1+P_2+...+P_n)/n $

# Calculate two SMAs
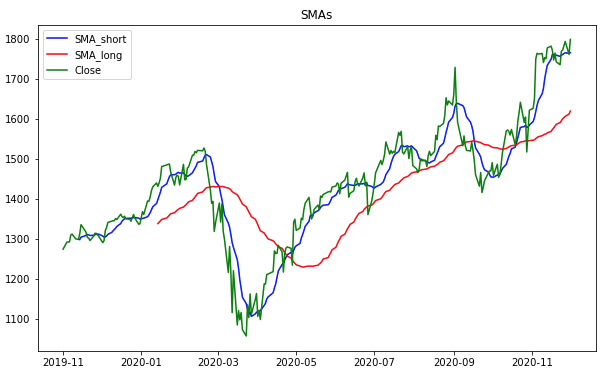
stock_data['SMA_short'] = talib.SMA(stock_data['Close'], timeperiod=10)
stock_data['SMA_long'] = talib.SMA(stock_data['Close'], timeperiod=50)

# Print the last five rows print(stock_data.tail())
             Close  SMA_short  SMA_long
Date                                   
2020-11-24 1768.88    1758.77   1594.74
2020-11-25 1771.43    1760.65   1599.75
2020-11-27 1793.19    1764.98   1605.70
2020-11-30 1760.74    1763.35   1611.71
2020-12-01 1798.10    1765.02   1619.05

Python으로 배우는 금융 트레이딩

SMA 그리기

import matplotlib.pyplot as plt

# Plot SMA with the price
plt.plot(stock_data['SMA_short'], 
         label='SMA_short')
plt.plot(stock_data['SMA_long'], 
         label='SMA_long')
plt.plot(stock_data['Close'], 
         label='Close')

# Customize and show the plot
plt.legend()
plt.title('SMAs')
plt.show()

SMA 차트

Python으로 배우는 금융 트레이딩

지수이동평균(EMA)

$EMA_n = P_n \times multiplier + \text{previous EMA} \times (1-multiplier)$

$multiplier = 2 / (n + 1)$

# Calculate two EMAs
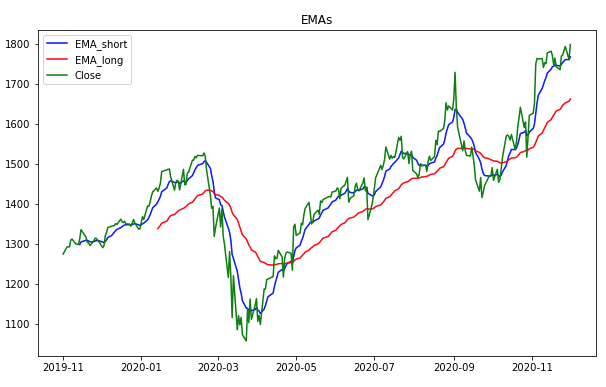
stock_data['EMA_short'] = talib.EMA(stock_data['Close'], timeperiod=10)
stock_data['EMA_long'] = talib.EMA(stock_data['Close'], timeperiod=50)
# Print the last five rows
print(stock_data.tail())
             Close  EMA_short  EMA_long
Date                                   
2020-11-24 1768.88    1748.65   1640.98
2020-11-25 1771.43    1752.79   1646.09
2020-11-27 1793.19    1760.13   1651.86
2020-11-30 1760.74    1760.24   1656.13
2020-12-01 1798.10    1767.13   1661.70
Python으로 배우는 금융 트레이딩

EMA 그리기

import matplotlib.pyplot as plt
# Plot EMA with the price
plt.plot(stock_data['EMA_short'], 
         label='EMA_short')
plt.plot(stock_data['EMA_long'], 
         label='EMA_long')
plt.plot(stock_data['Close'], 
         label='Close')

# Customize and show the plot
plt.legend()
plt.title('EMAs')
plt.show()

EMA 차트

Python으로 배우는 금융 트레이딩

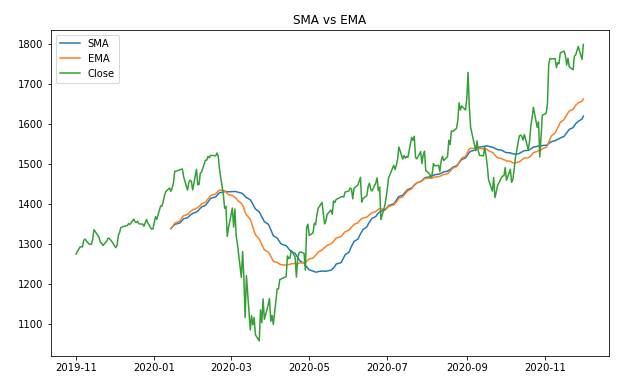
SMA vs. EMA

EMA는 최신 가격 변동에 더 민감합니다

동일한 조회 창으로 계산한 SMA vs EMA 비교 차트

Python으로 배우는 금융 트레이딩

연습해 봅시다!

Python으로 배우는 금융 트레이딩

Preparing Video For Download...