예측 만들기

Python으로 배우는 Bayesian 데이터 분석

Michal Oleszak

Machine Learning Engineer

클릭수 모델 다시 보기

formula = "num_clicks ~ clothes_banners_shown + sneakers_banners_shown + weekend"

with pm.Model() as model_2:
    pm.GLM.from_formula(formula, data=ads_aggregated)
    trace_2 = pm.sample(draws=1000, tune=500)
Python으로 배우는 Bayesian 데이터 분석

광고 테스트 데이터

print(ads_test)
   clothes_banners_shown  sneakers_banners_shown  num_clicks  weekend
0                     40                      36           7     True
1                     42                      47           8    False
2                     45                      37          11    False
3                     22                      15           4    False
4                     20                      18           2    False
Python으로 배우는 Bayesian 데이터 분석

예측 분포 샘플링

with pm.Model() as model:

pm.GLM.from_formula(formula, data=ads_test)
posterior_predictive = pm.fast_sample_posterior_predictive(trace_2)
Python으로 배우는 Bayesian 데이터 분석

예측 추출값

posterior_predictive["y"].shape
(4000, 5)
print(posterior_predictive["y"])
array([[12.83527253, 10.22454815, 11.20386868,  7.50227286,  6.85458594],
       [ 3.1015655 ,  6.1253004 , 11.38324931,  2.1844722 ,  4.21451756],
       [ 3.40141276,  9.10157964,  6.57689421,  8.26669814,  4.23812161],
       ...,
       [10.97303606,  9.0772305 , 10.6877039 ,  1.78448969,  6.75663075],
       [ 8.53734584, 12.14079593, 11.00969881,  4.69875055,  8.317338  ],
       [16.44713387, 17.35163824, 19.59359831,  2.84058536,  4.21108186]])
Python으로 배우는 Bayesian 데이터 분석

예측은 얼마나 좋은가?

   clothes_banners_shown  sneakers_banners_shown  num_clicks  weekend
0                     40                      36           7     True
pm.plot_posterior(posterior_predictive["y"][:, 0])
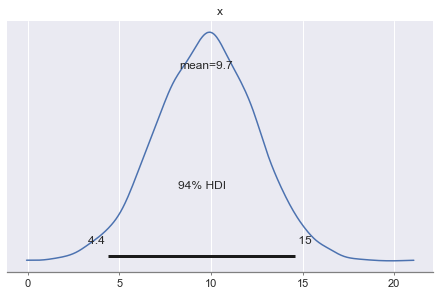
예측 추출값의 밀도 플롯. 평균과 신뢰구간이 표시됨.

Python으로 배우는 Bayesian 데이터 분석

테스트 오류 분포

errors = []


for index, test_example in ads_test.iterrows():
error = posterior_predictive["y"][:, index] - test_example["num_clicks"]
errors.append(error)
error_distribution = np.array(errors).reshape(-1)
error_distribution.shape
(20000,)
pm.plot_posterior(error_distribution)
Python으로 배우는 Bayesian 데이터 분석

테스트 오류 분포

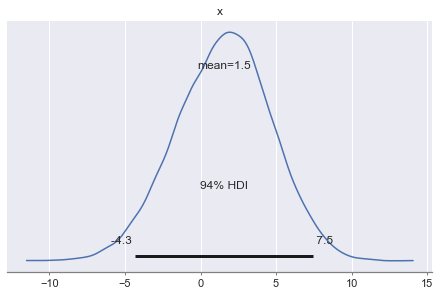
모델 오류의 밀도 플롯. 평균과 신뢰구간이 표시됨.

Python으로 배우는 Bayesian 데이터 분석

예측해 봅시다!

Python으로 배우는 Bayesian 데이터 분석

Preparing Video For Download...