연도 및 크기로 주택 가격 설명하기

Tidyverse로 하는 데이터 모델링

Albert Y. Kim

Assistant Professor of Statistical and Data Sciences

복습: 시애틀 주택 가격

library(dplyr)
library(moderndive)

# Preview only certain variables:
house_prices %>% 
  select(price, sqft_living, condition, waterfront) %>% 
  glimpse()
Observations: 21,613
Variables: 4
$ price       <dbl> 221900, 538000, 180000, 604000...
$ sqft_living <int> 1180, 2570, 770, 1960, 1680, 5420...
$ condition   <fct> 3, 3, 3, 5, 3, 3, 3, 3, 3, 3, 3...
Tidyverse로 하는 데이터 모델링

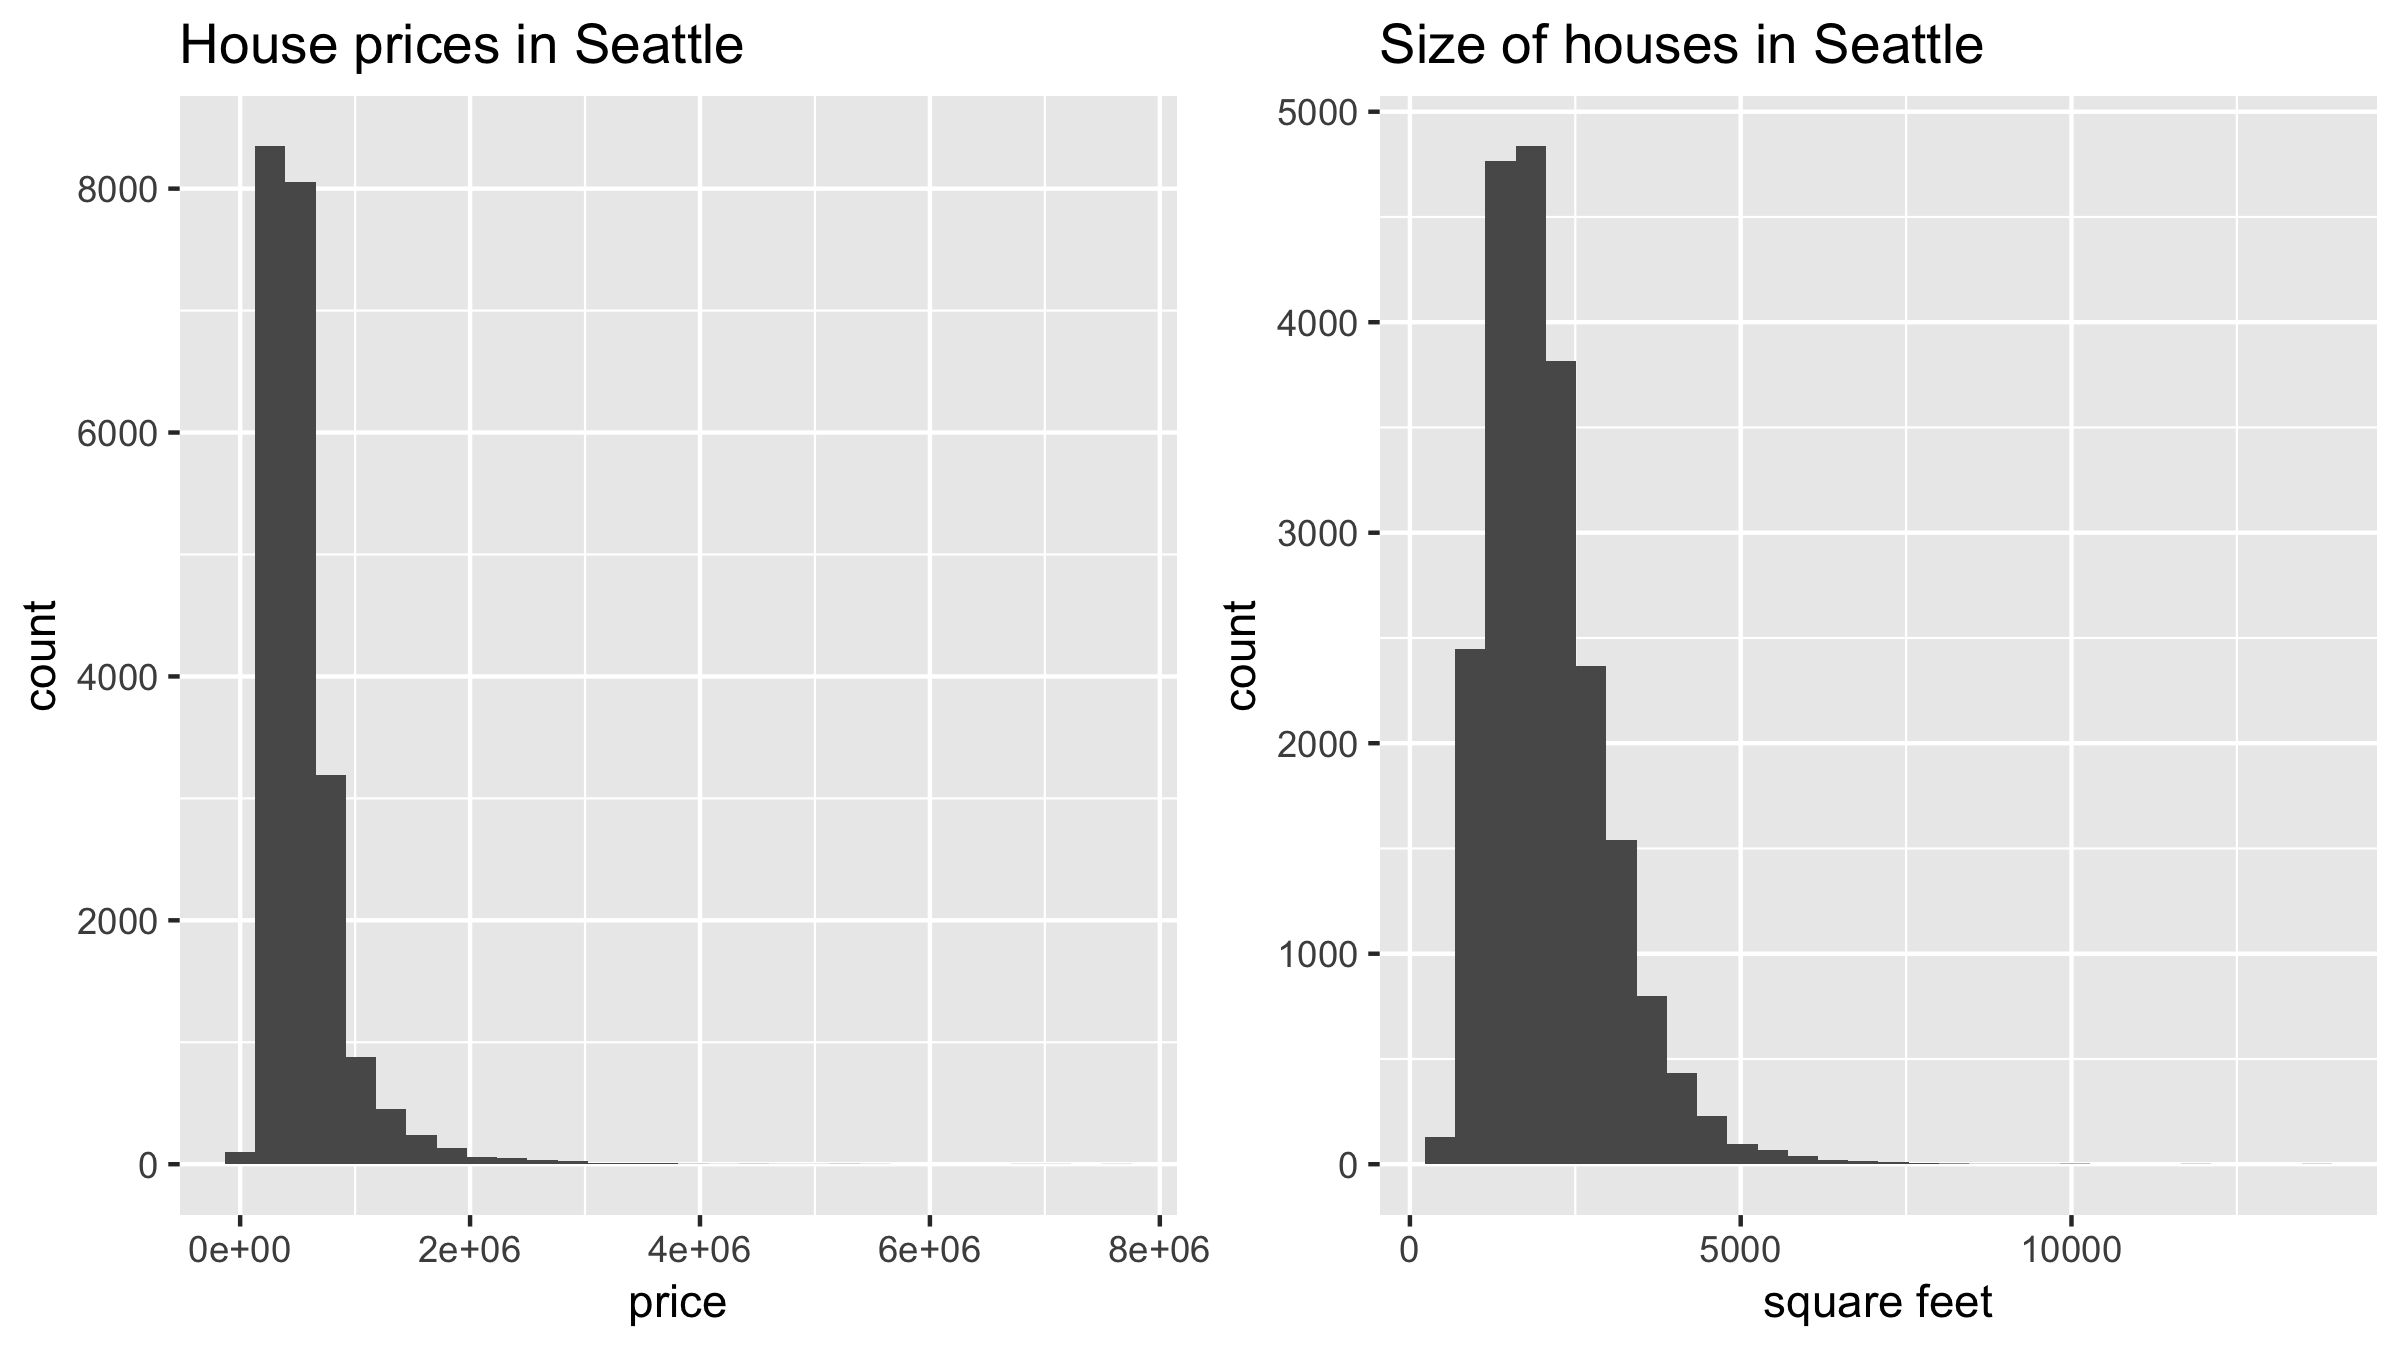
복습: 가격 및 크기 변수

Tidyverse로 하는 데이터 모델링

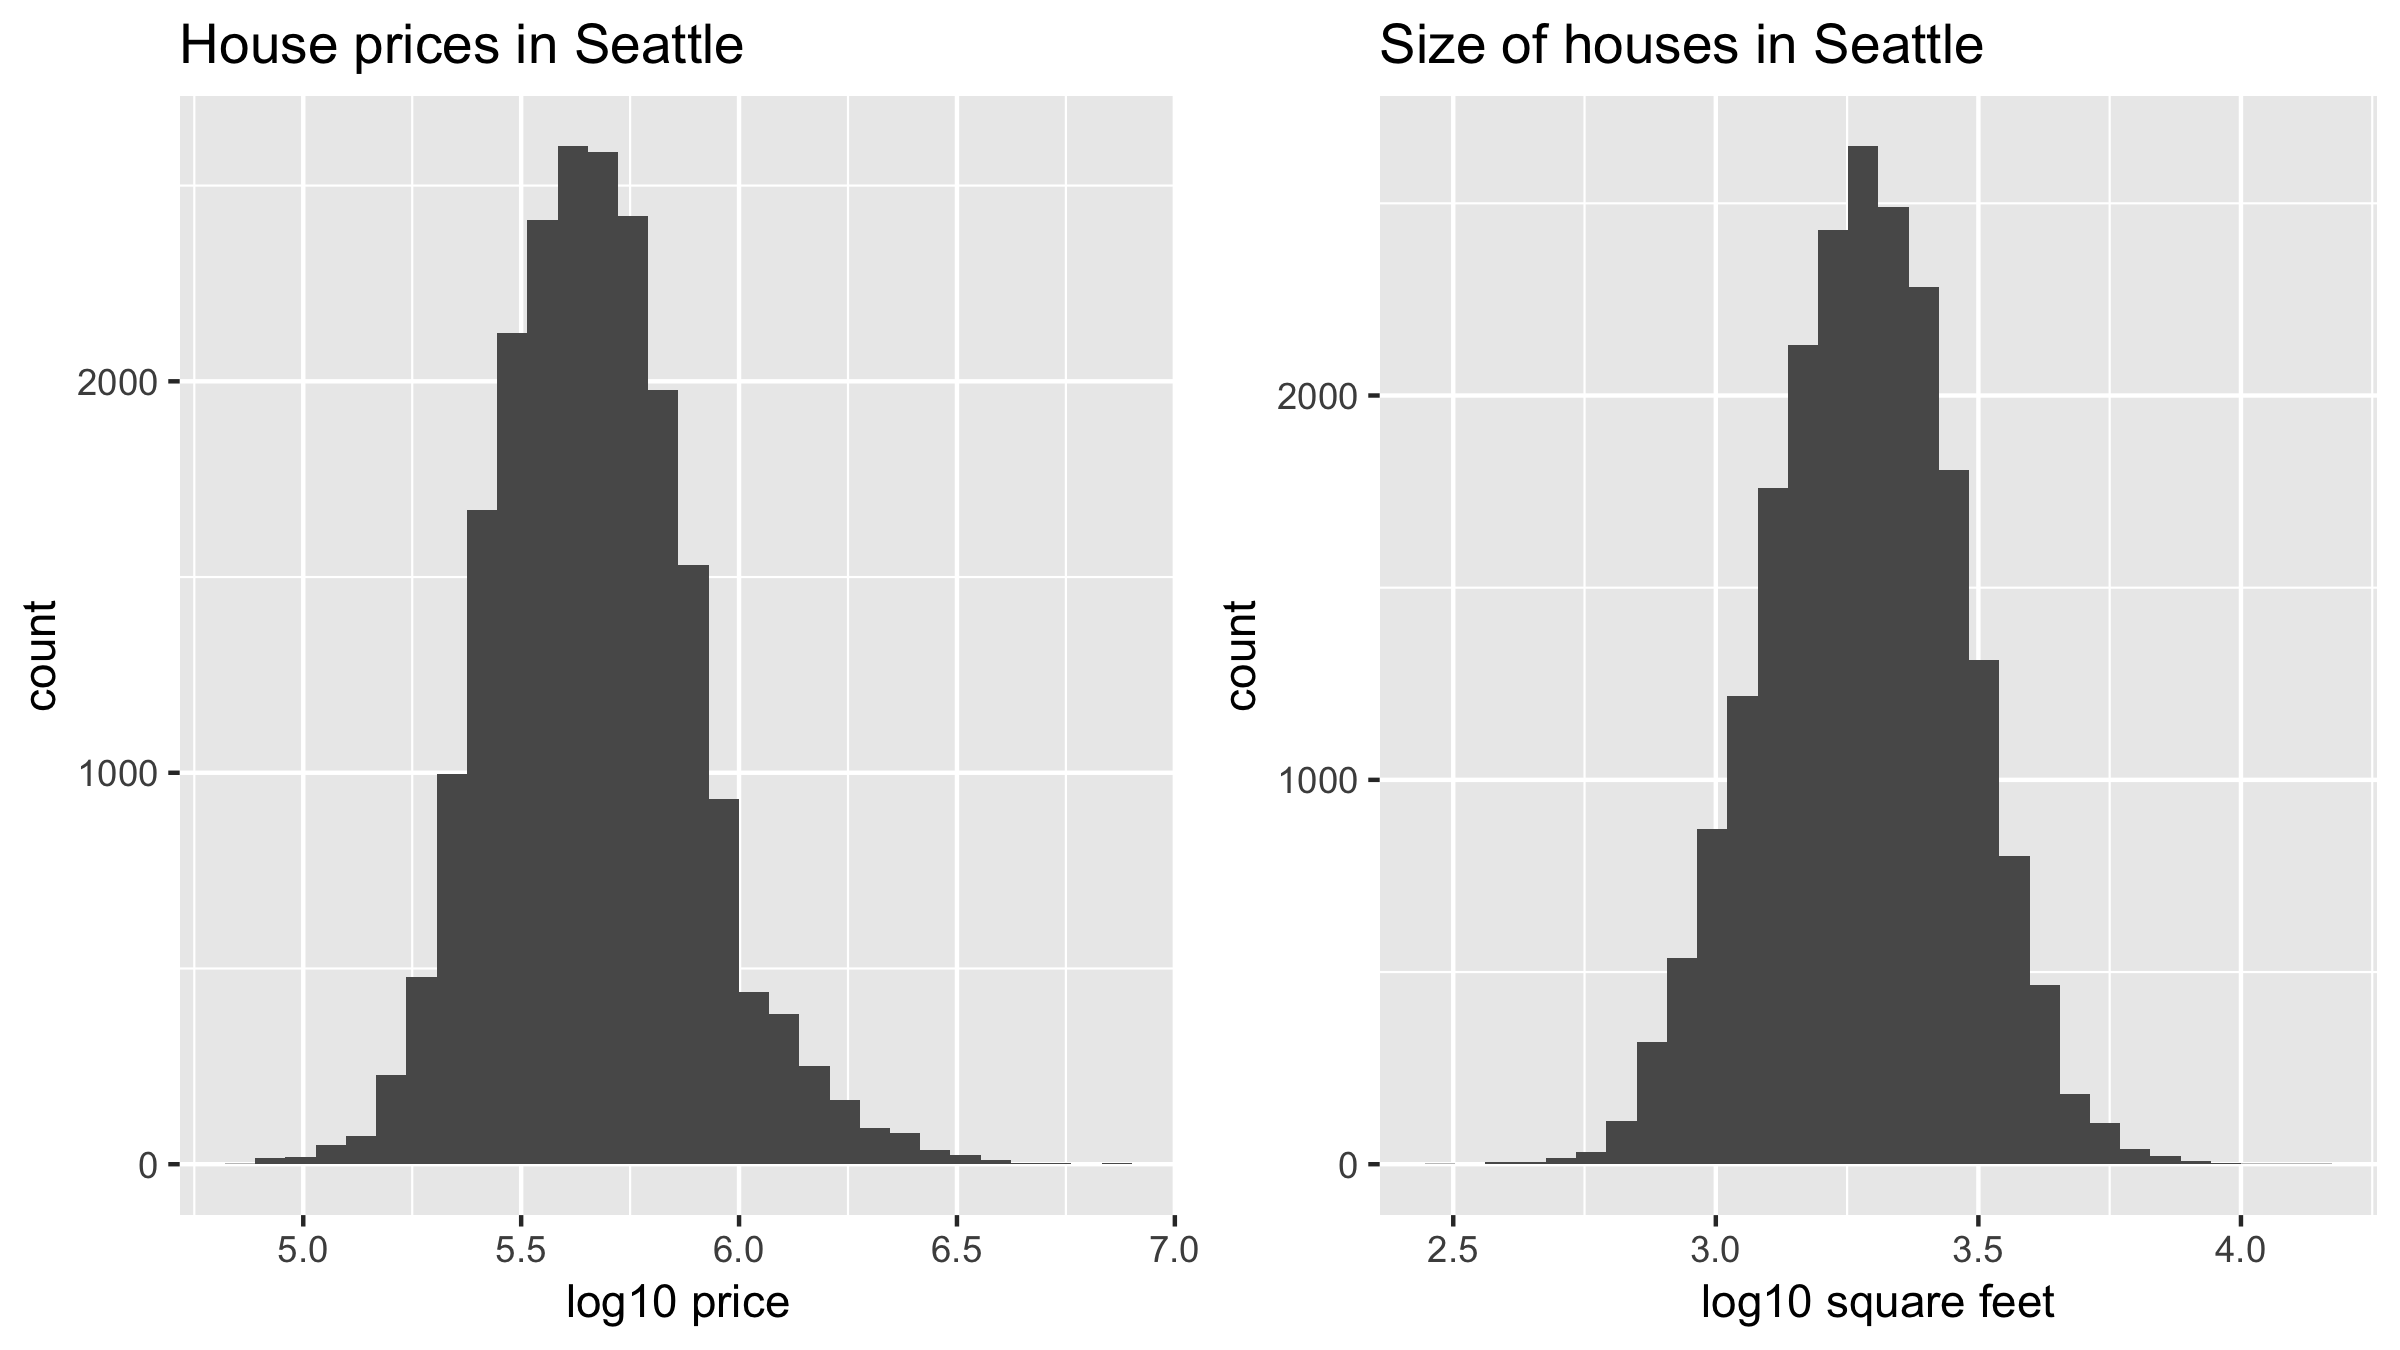
복습: log10 변환

Tidyverse로 하는 데이터 모델링

복습: 데이터 변환

# log10() transform price and size
house_prices <- house_prices %>%
  mutate(
    log10_price = log10(price),
    log10_size = log10(sqft_living)
  )
Tidyverse로 하는 데이터 모델링

주택 가격 모델

  • 결과 변수 $y$ - 주택 가격 (USD): price
  • 두 개의 수치형 설명/예측 변수:
    • $x_1$ - 주택 크기: log10_size
    • $x_2$ - 건축 연도: yr_built
Tidyverse로 하는 데이터 모델링

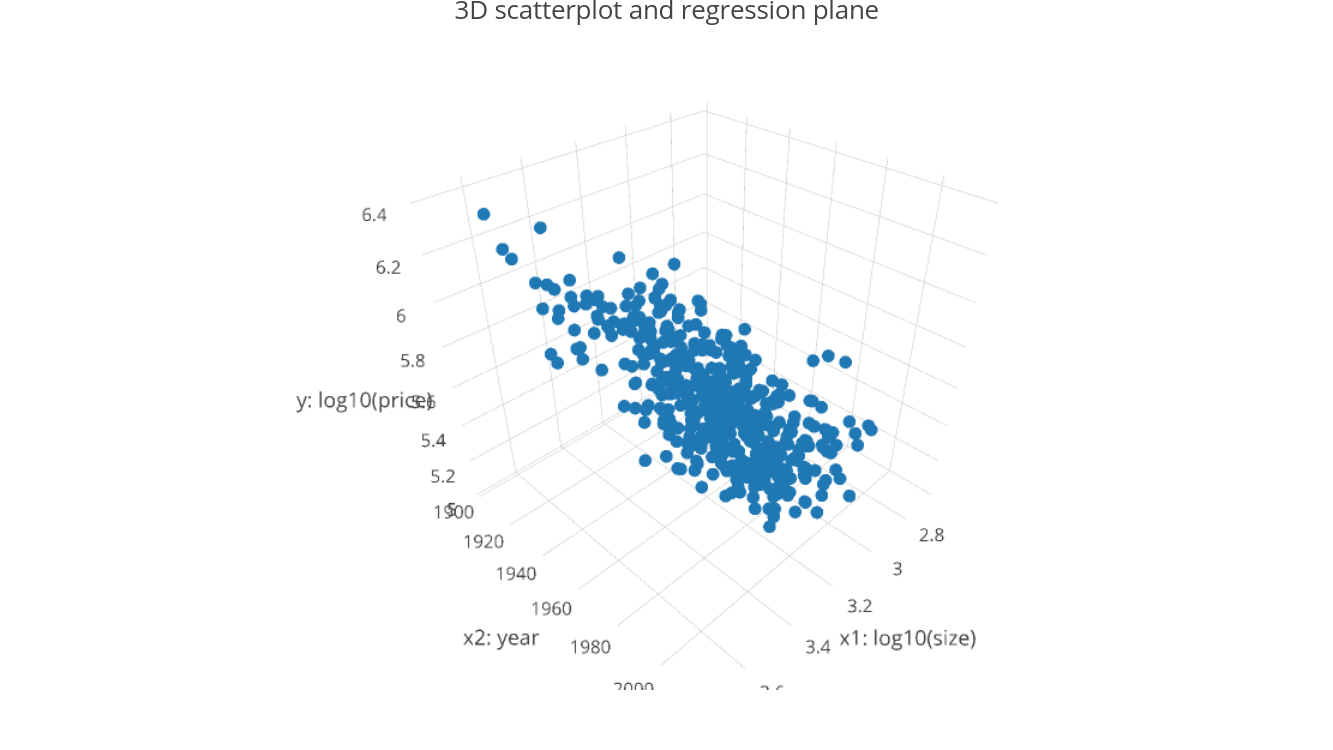
주택 가격, 크기, 연도의 탐색적 시각화

log10_price, log10_size, yr_built의 3D 산점도
Tidyverse로 하는 데이터 모델링

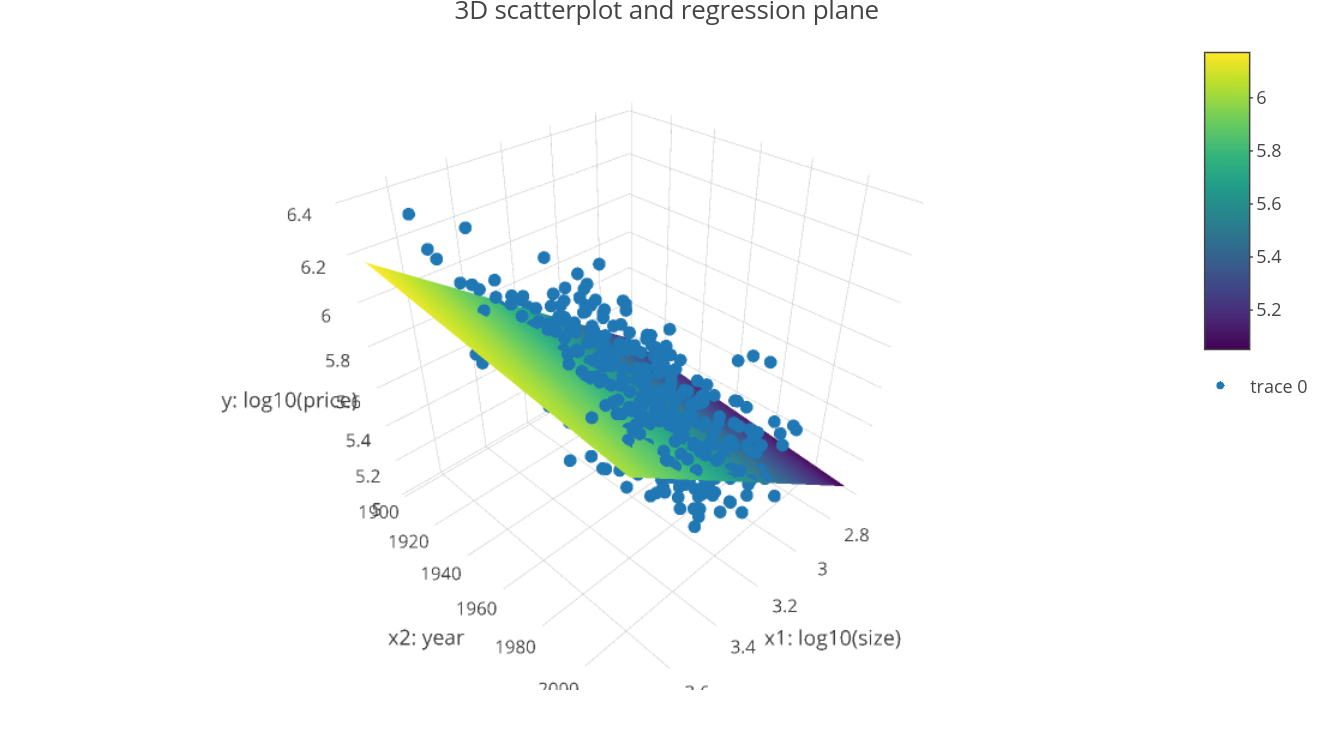
회귀 평면

회귀 평면이 포함된 3D 산점도 (인터랙티브 버전 링크).
Tidyverse로 하는 데이터 모델링

회귀 테이블

# Fit regression model using formula of form: y ~ x1 + x2
model_price_1 <- lm(log10_price ~ log10_size + yr_built, 
                    data = house_prices)

# Output regression table get_regression_table(model_price_1)
# A tibble: 3 x 7
  term       estimate std_error statistic p_value...
  <chr>         <dbl>     <dbl>     <dbl>   <dbl>...
1 intercept   5.38      0.0754       71.4       0...
2 log10_size  0.913     0.00647     141.        0...
3 yr_built   -0.00138   0.00004     -33.8       0...
Tidyverse로 하는 데이터 모델링

연습해 봅시다!

Tidyverse로 하는 데이터 모델링

Preparing Video For Download...