R-제곱을 이용한 모델 적합도 평가

Tidyverse로 하는 데이터 모델링

Albert Y. Kim

Assistant Professor of Statistical and Data Sciences

R-제곱

$R^2 = 1 - \frac{\text{Var}(\text{residuals})}{\text{Var}(y)}$
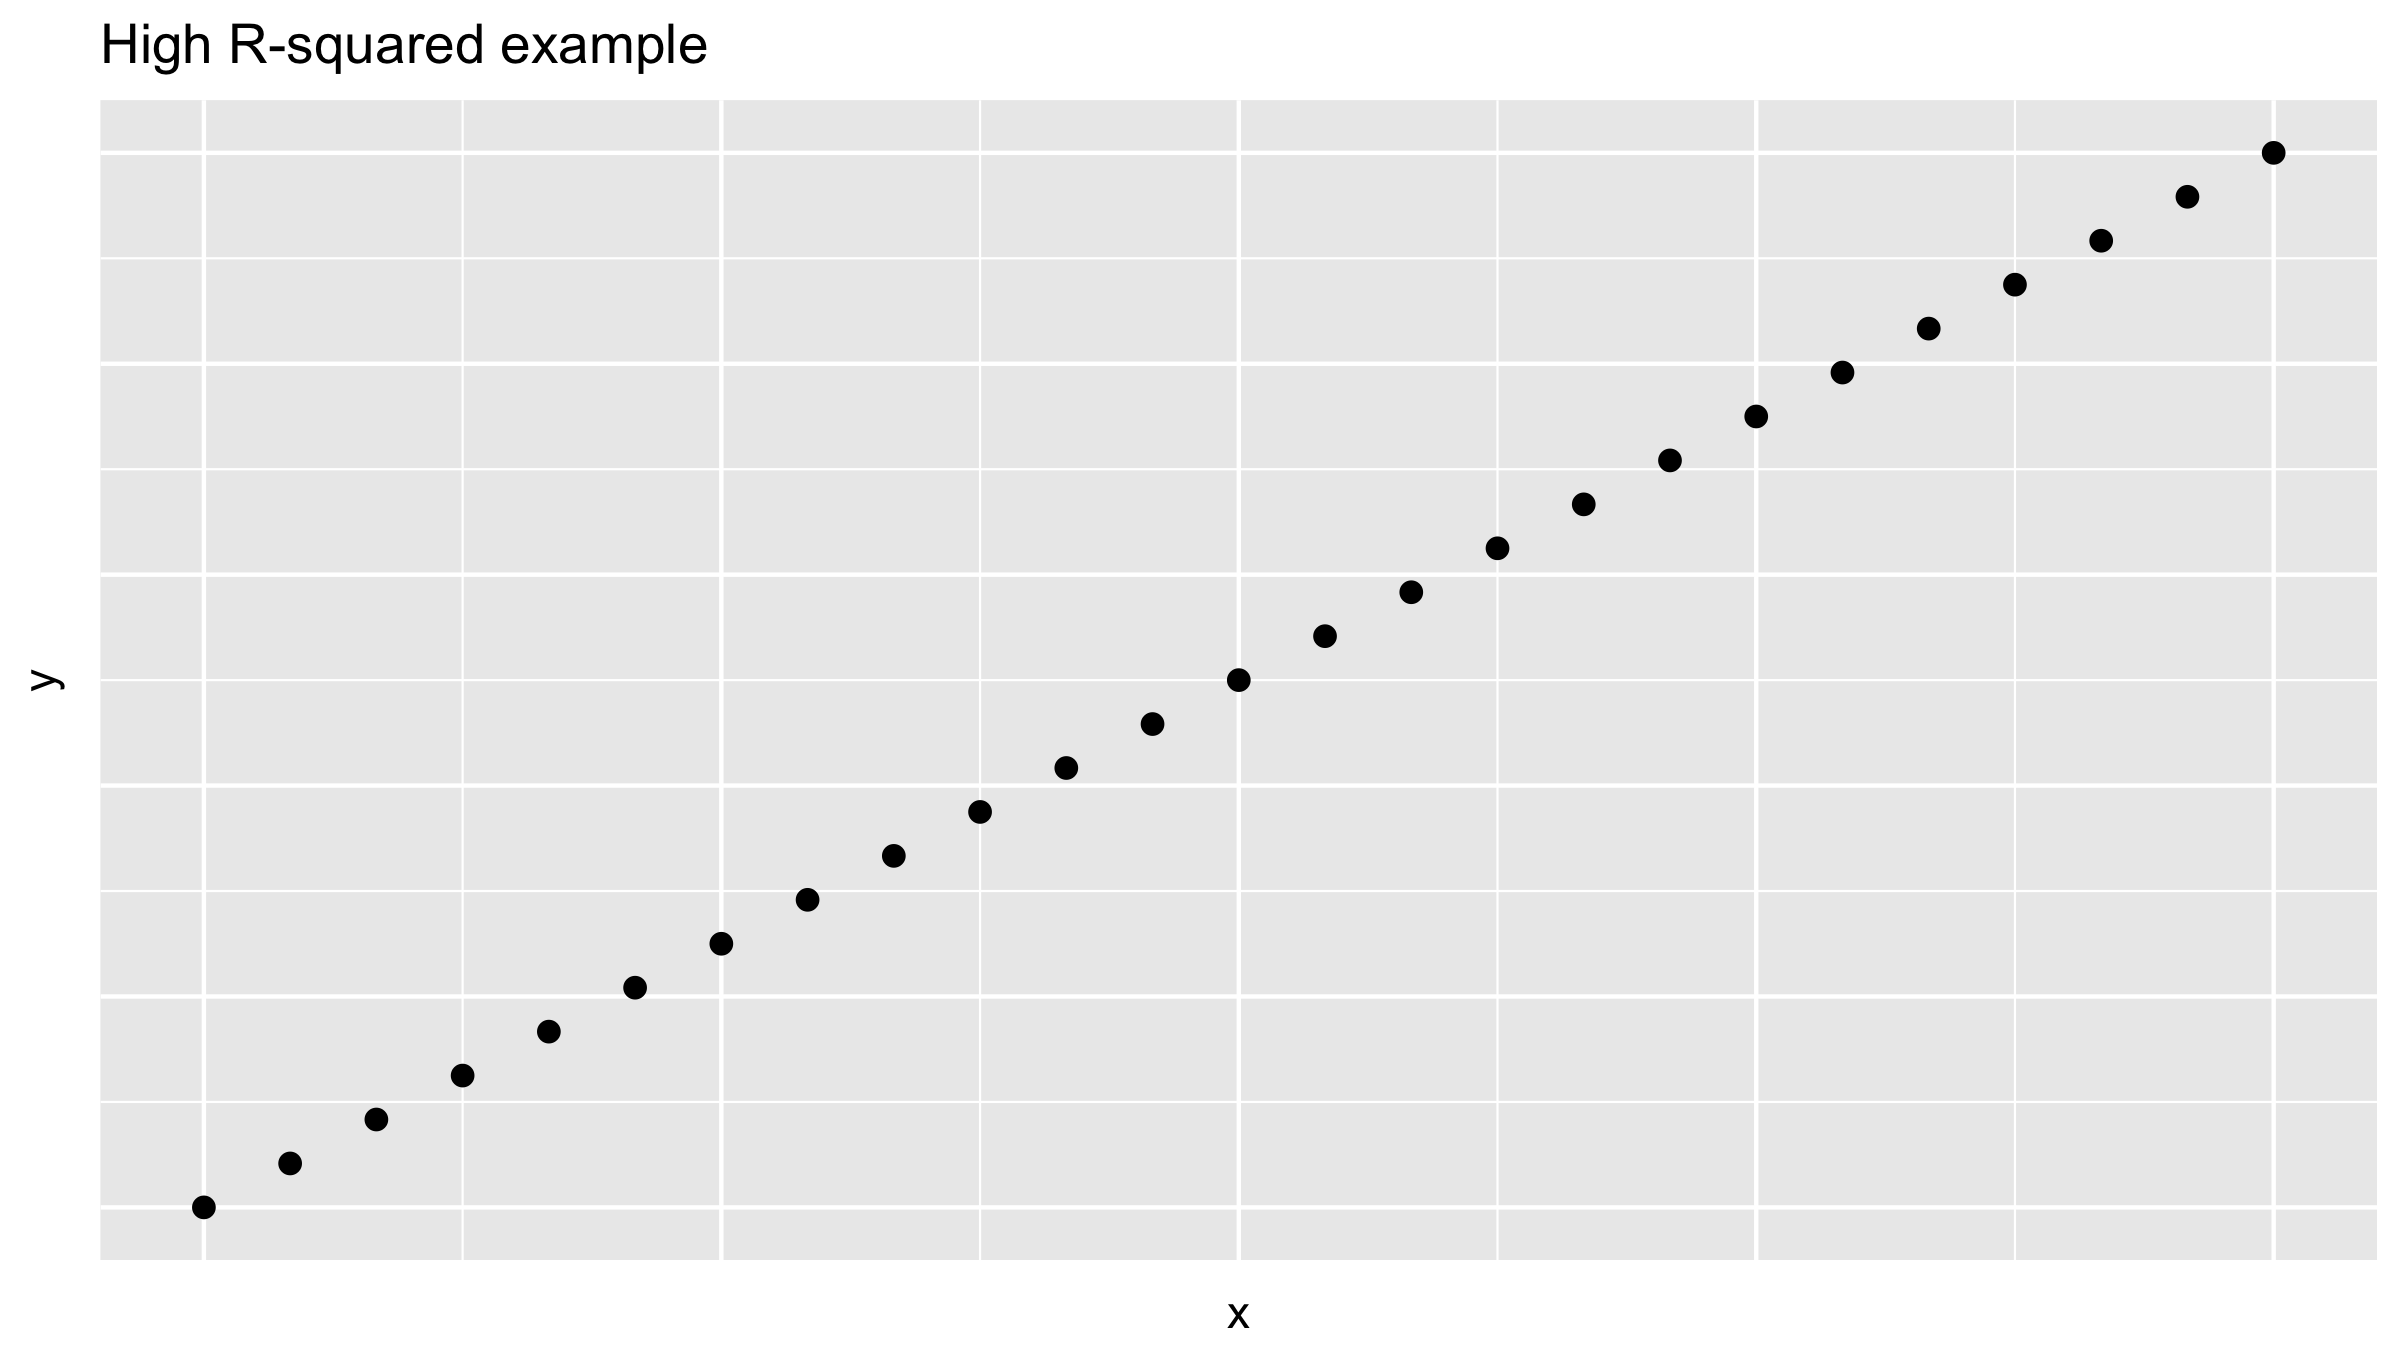
  • $R^2$는 0과 1 사이의 값
  • $R^2$이 작을수록 ~ "낮은 적합도"
  • $R^2 = 1$ ~ "완벽한 적합", $R^2 = 0$ ~ "적합 없음"
Tidyverse로 하는 데이터 모델링

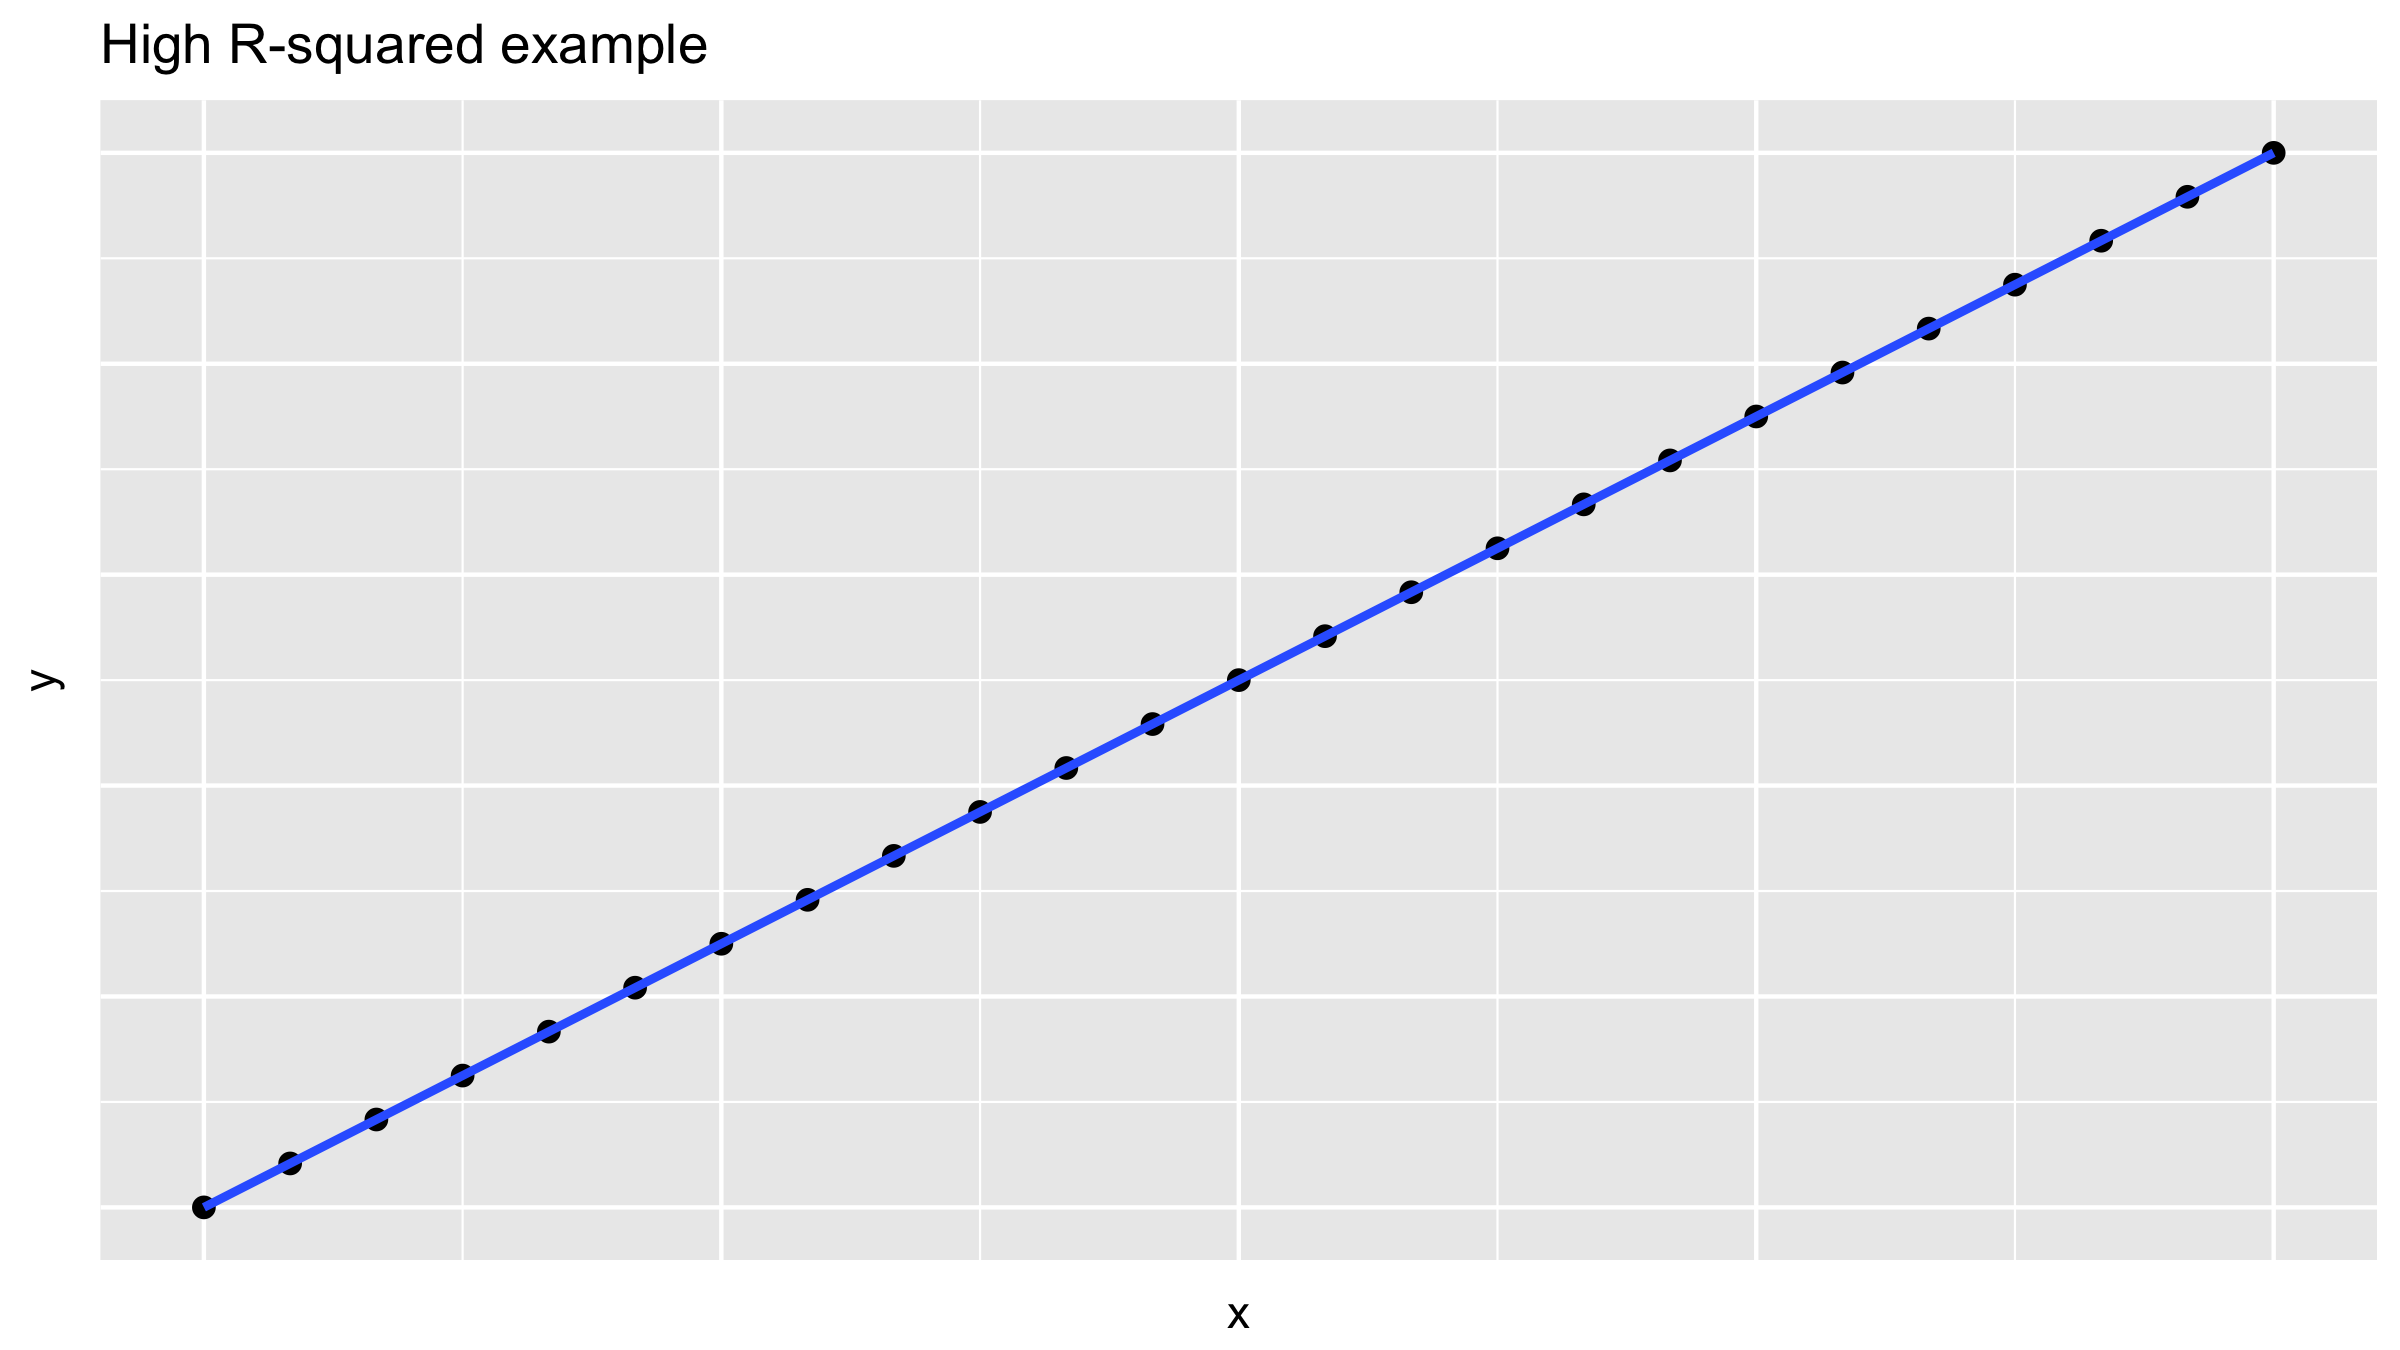
높은 R-제곱 값 예시

$R^2 = 1 - \frac{\text{Var}(\text{residuals})}{\text{Var}(y)}$
Tidyverse로 하는 데이터 모델링

높은 R-제곱 값: "완벽한" 적합

$R^2 = 1 - \frac{\text{Var}(\text{residuals})}{\text{Var}(y)}$
Tidyverse로 하는 데이터 모델링

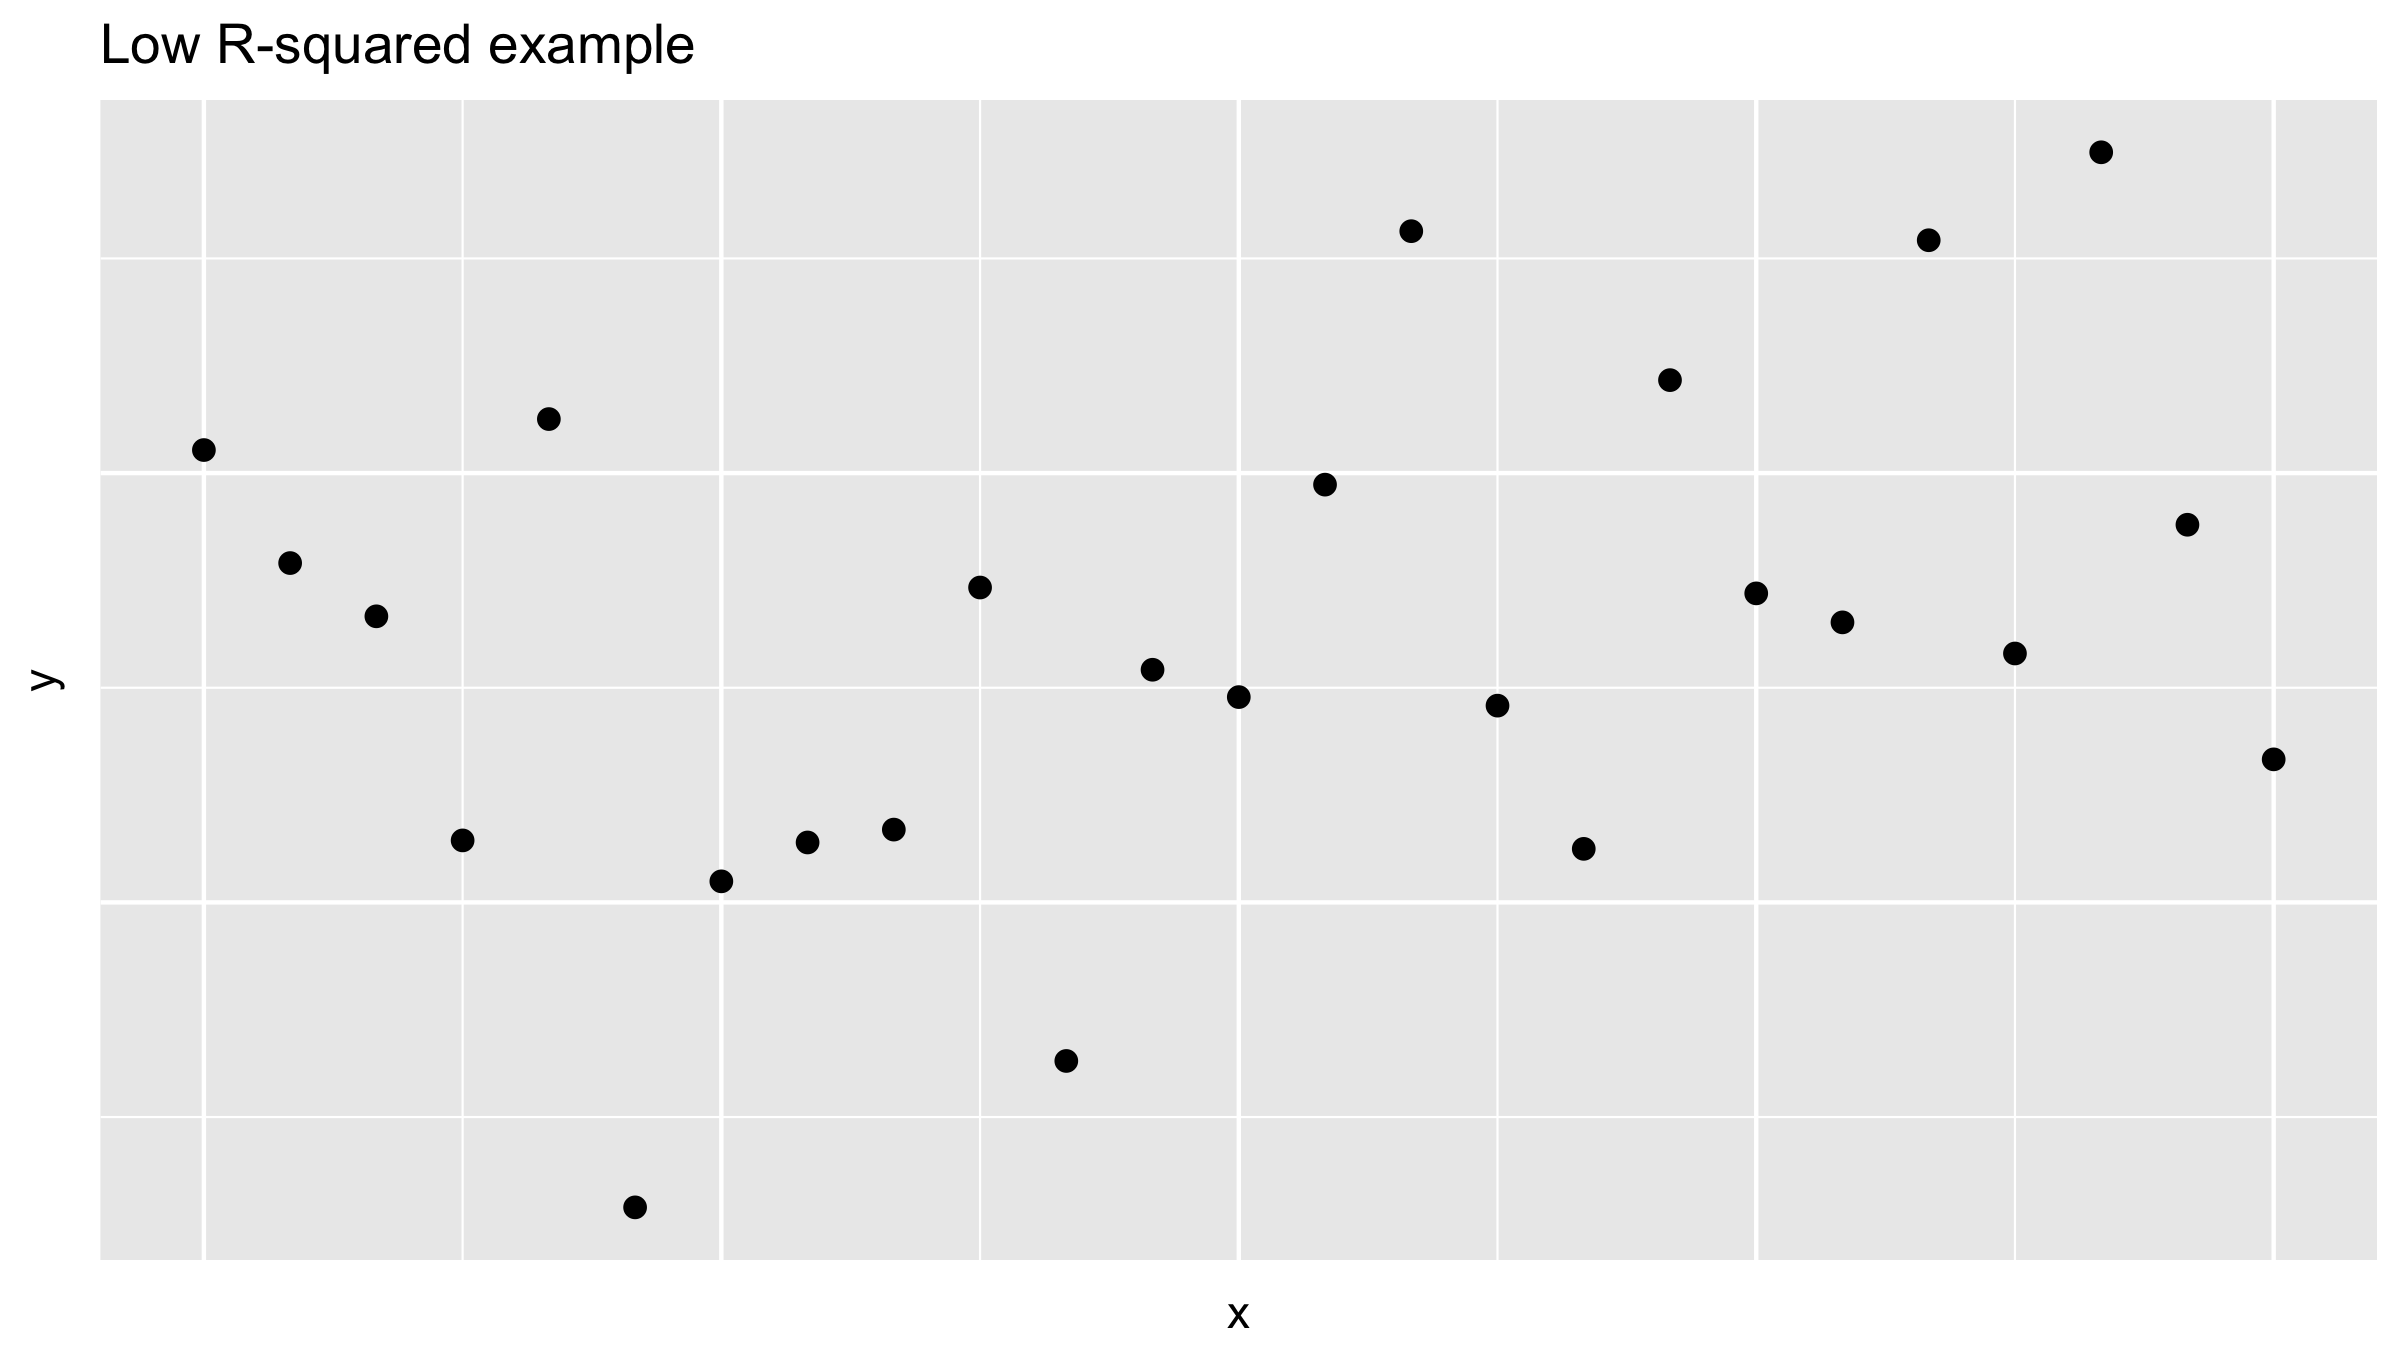
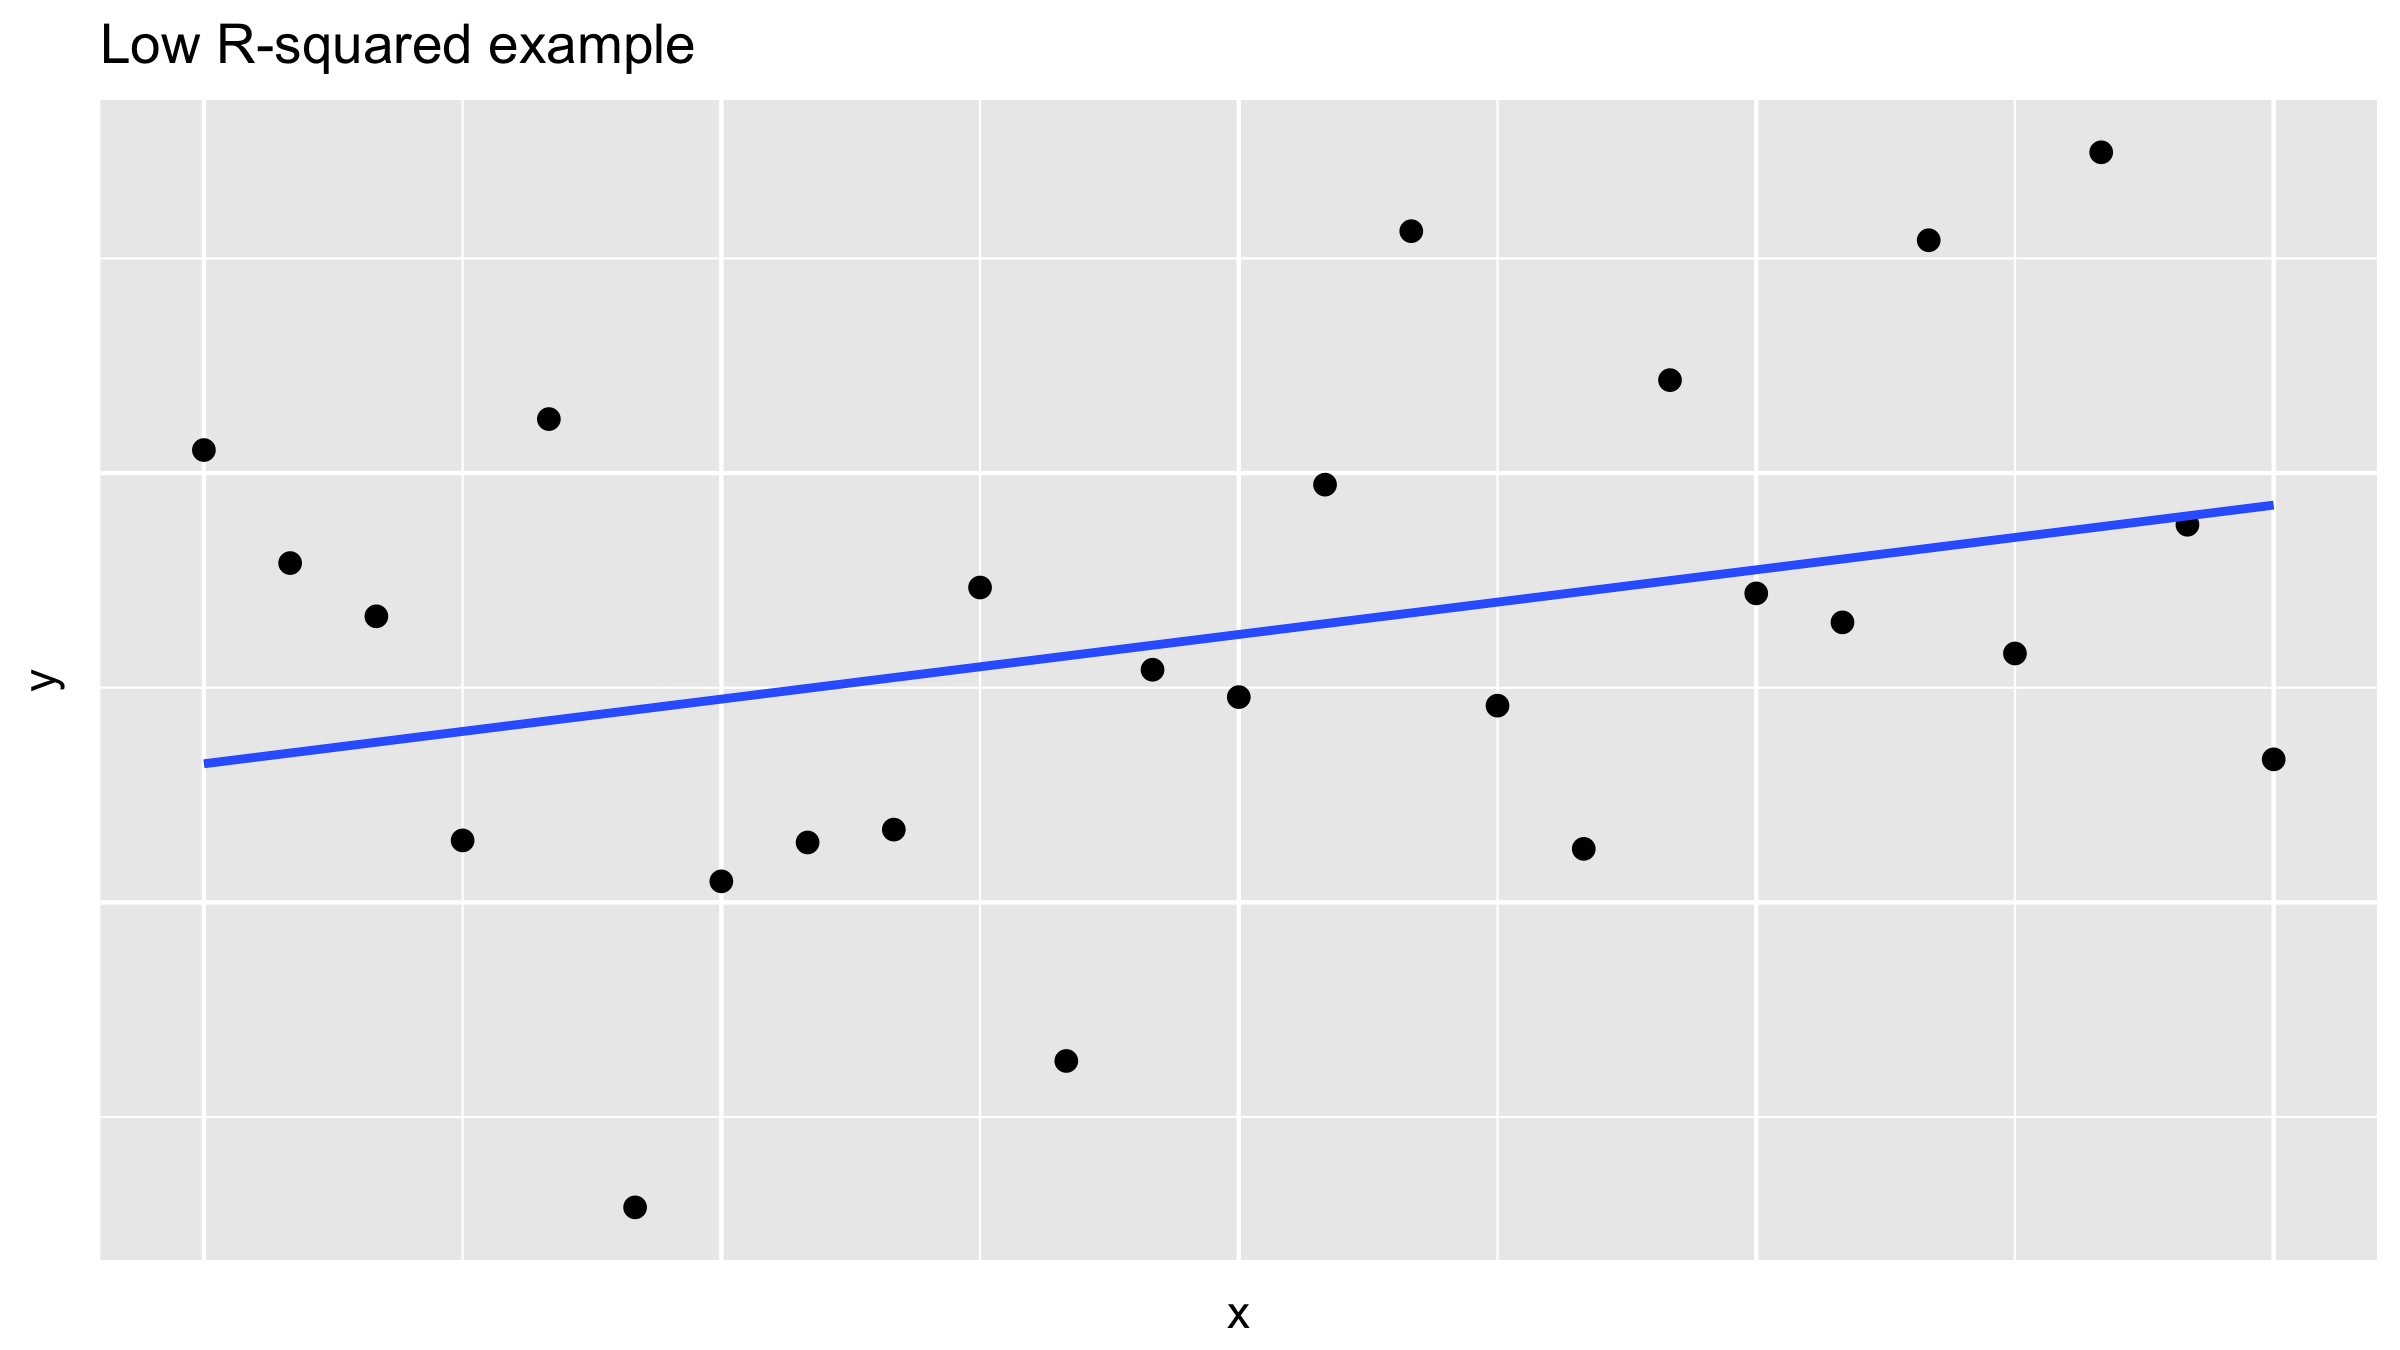
낮은 R-제곱 값 예시

$R^2 = 1 - \frac{\text{Var}(\text{residuals})}{\text{Var}(y)}$
Tidyverse로 하는 데이터 모델링

낮은 R-제곱 값 예시

$R^2 = 1 - \frac{\text{Var}(\text{residuals})}{\text{Var}(y)}$

Tidyverse로 하는 데이터 모델링

수치적 해석

$$

$\text{Var}(y) \geq \text{Var}(\text{residuals})$이므로 $$

$R^2 = 1 - \frac{\text{Var}(\text{residuals})}{\text{Var}(y)} = \frac{\text{Var}(y) - \text{Var}(\text{residuals})}{\text{Var}(y)}$

$$

$R^2$의 해석: 모델이 설명하는 결과 변수 $y$의 총 변동 비율

Tidyverse로 하는 데이터 모델링

R-제곱 계산

# Model 1: price as a function of size and year built
model_price_1 <- lm(log10_price ~ log10_size + yr_built,
                    data = house_prices)

get_regression_points(model_price_1) %>%
  summarize(r_squared = 1 - var(residual)/var(log10_price))
# A tibble: 1 x 1
  r_squared
      <dbl>
1     0.483
Tidyverse로 하는 데이터 모델링

R-제곱 계산

# Model 3: price as a function of size and condition
model_price_3 <- lm(log10_price ~ log10_size + condition,
                    data = house_prices)

get_regression_points(model_price_3) %>%
  summarize(r_squared = 1 - var(residual)/var(log10_price))
# A tibble: 1 x 1
  r_squared
      <dbl>
1     0.462
Tidyverse로 하는 데이터 모델링

연습해 봅시다!

Tidyverse로 하는 데이터 모델링

Preparing Video For Download...