Tidyverse로 하는 데이터 모델링
Albert Y. Kim
Assistant Professor of Statistical and Data Sciences
$$
$$y = f(\vec{x}) + \epsilon$$
여기서:
모델링 목적:
텍사스 대학교 오스틴 캠퍼스의 강의 평가 점수 연구 (openintro.org 에서 이용 가능).
질문: 교수자의 다양한 속성으로 강의 평가 점수의 차이를 설명할 수 있는가?
변수:
score
rank
gender
age
bty_avg
ModernDive.com의 moderndive 패키지:
moderndive
library(dplyr)
library(moderndive)
glimpse(evals)
Observations: 463
Variables: 13
$ ID           <int> 1, 2, 3, 4, 5, 6, 7, 8, 9, 10...
$ score        <dbl> 4.7, 4.1, 3.9, 4.8, 4.6, 4.3...
$ age          <int> 36, 36, 36, 36, 59, 59, 59, 51...
$ bty_avg      <dbl> 5.000, 5.000, 5.000, 5.000...
$ gender       <fct> female, female, female, female...
...
탐색적 데이터 분석(EDA)의 세 가지 기본 단계:
library(ggplot2)
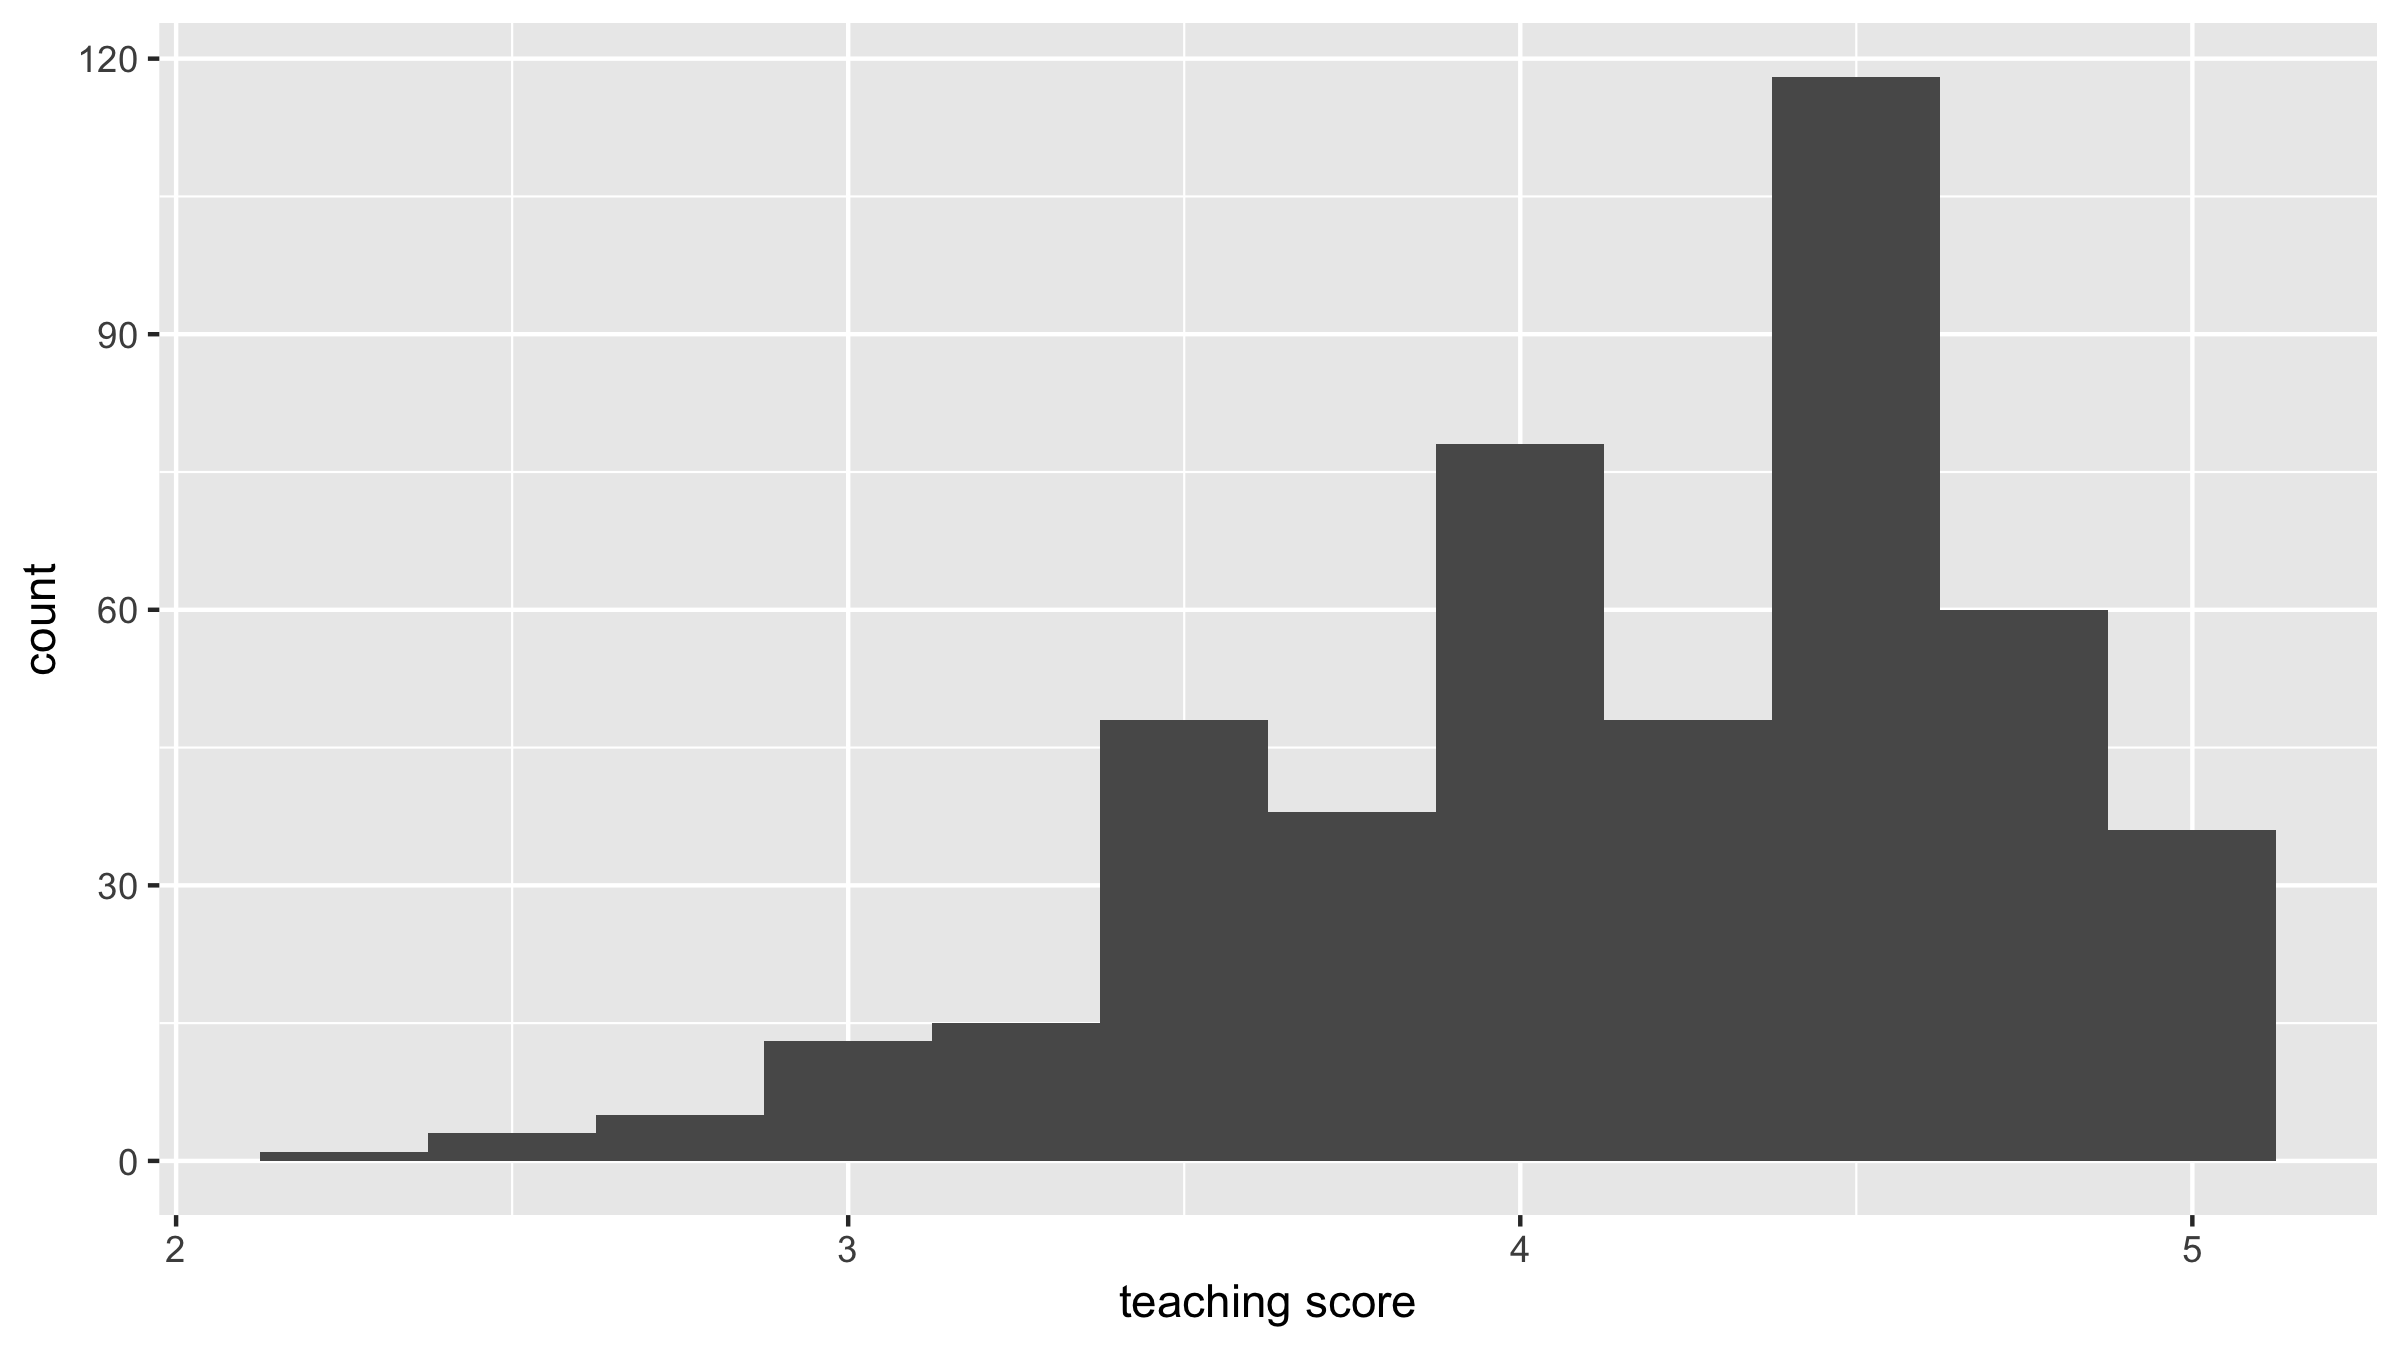
ggplot(evals, aes(x = score)) +
  geom_histogram(binwidth = 0.25) +
  labs(x = "teaching score", y = "count")
# Compute mean, median, and standard deviation
evals %>%
  summarize(mean_score = mean(score),
            median_score = median(score),
            sd_score = sd(score))
# A tibble: 1 x 3
  mean_score median_score sd_score
       <dbl>        <dbl>    <dbl>
1       4.17          4.3    0.544