Tidyverse로 하는 데이터 모델링
Albert Y. Kim
Assistant Professor of Statistical and Data Sciences
시애틀 인근 워싱턴주 킹 카운티의 주택 가격 데이터셋(Kaggle.com 제공).
질문: 주택의 특성을 바탕으로 판매 가격을 예측할 수 있을까요?
변수:
price
sqft_living
condition
bedrooms
yr_built
waterfront
moderndive 패키지 (ModernDive) 제공:
moderndive
library(dplyr)
library(moderndive)
glimpse(house_prices)
Observations: 21,613
Variables: 21
$ id            <chr> "7129300520", "6414100192"...
$ date          <dttm> 2014-10-13, 2014-12-09, 2015...
$ price         <dbl> 221900, 538000, 180000, 604000...
...
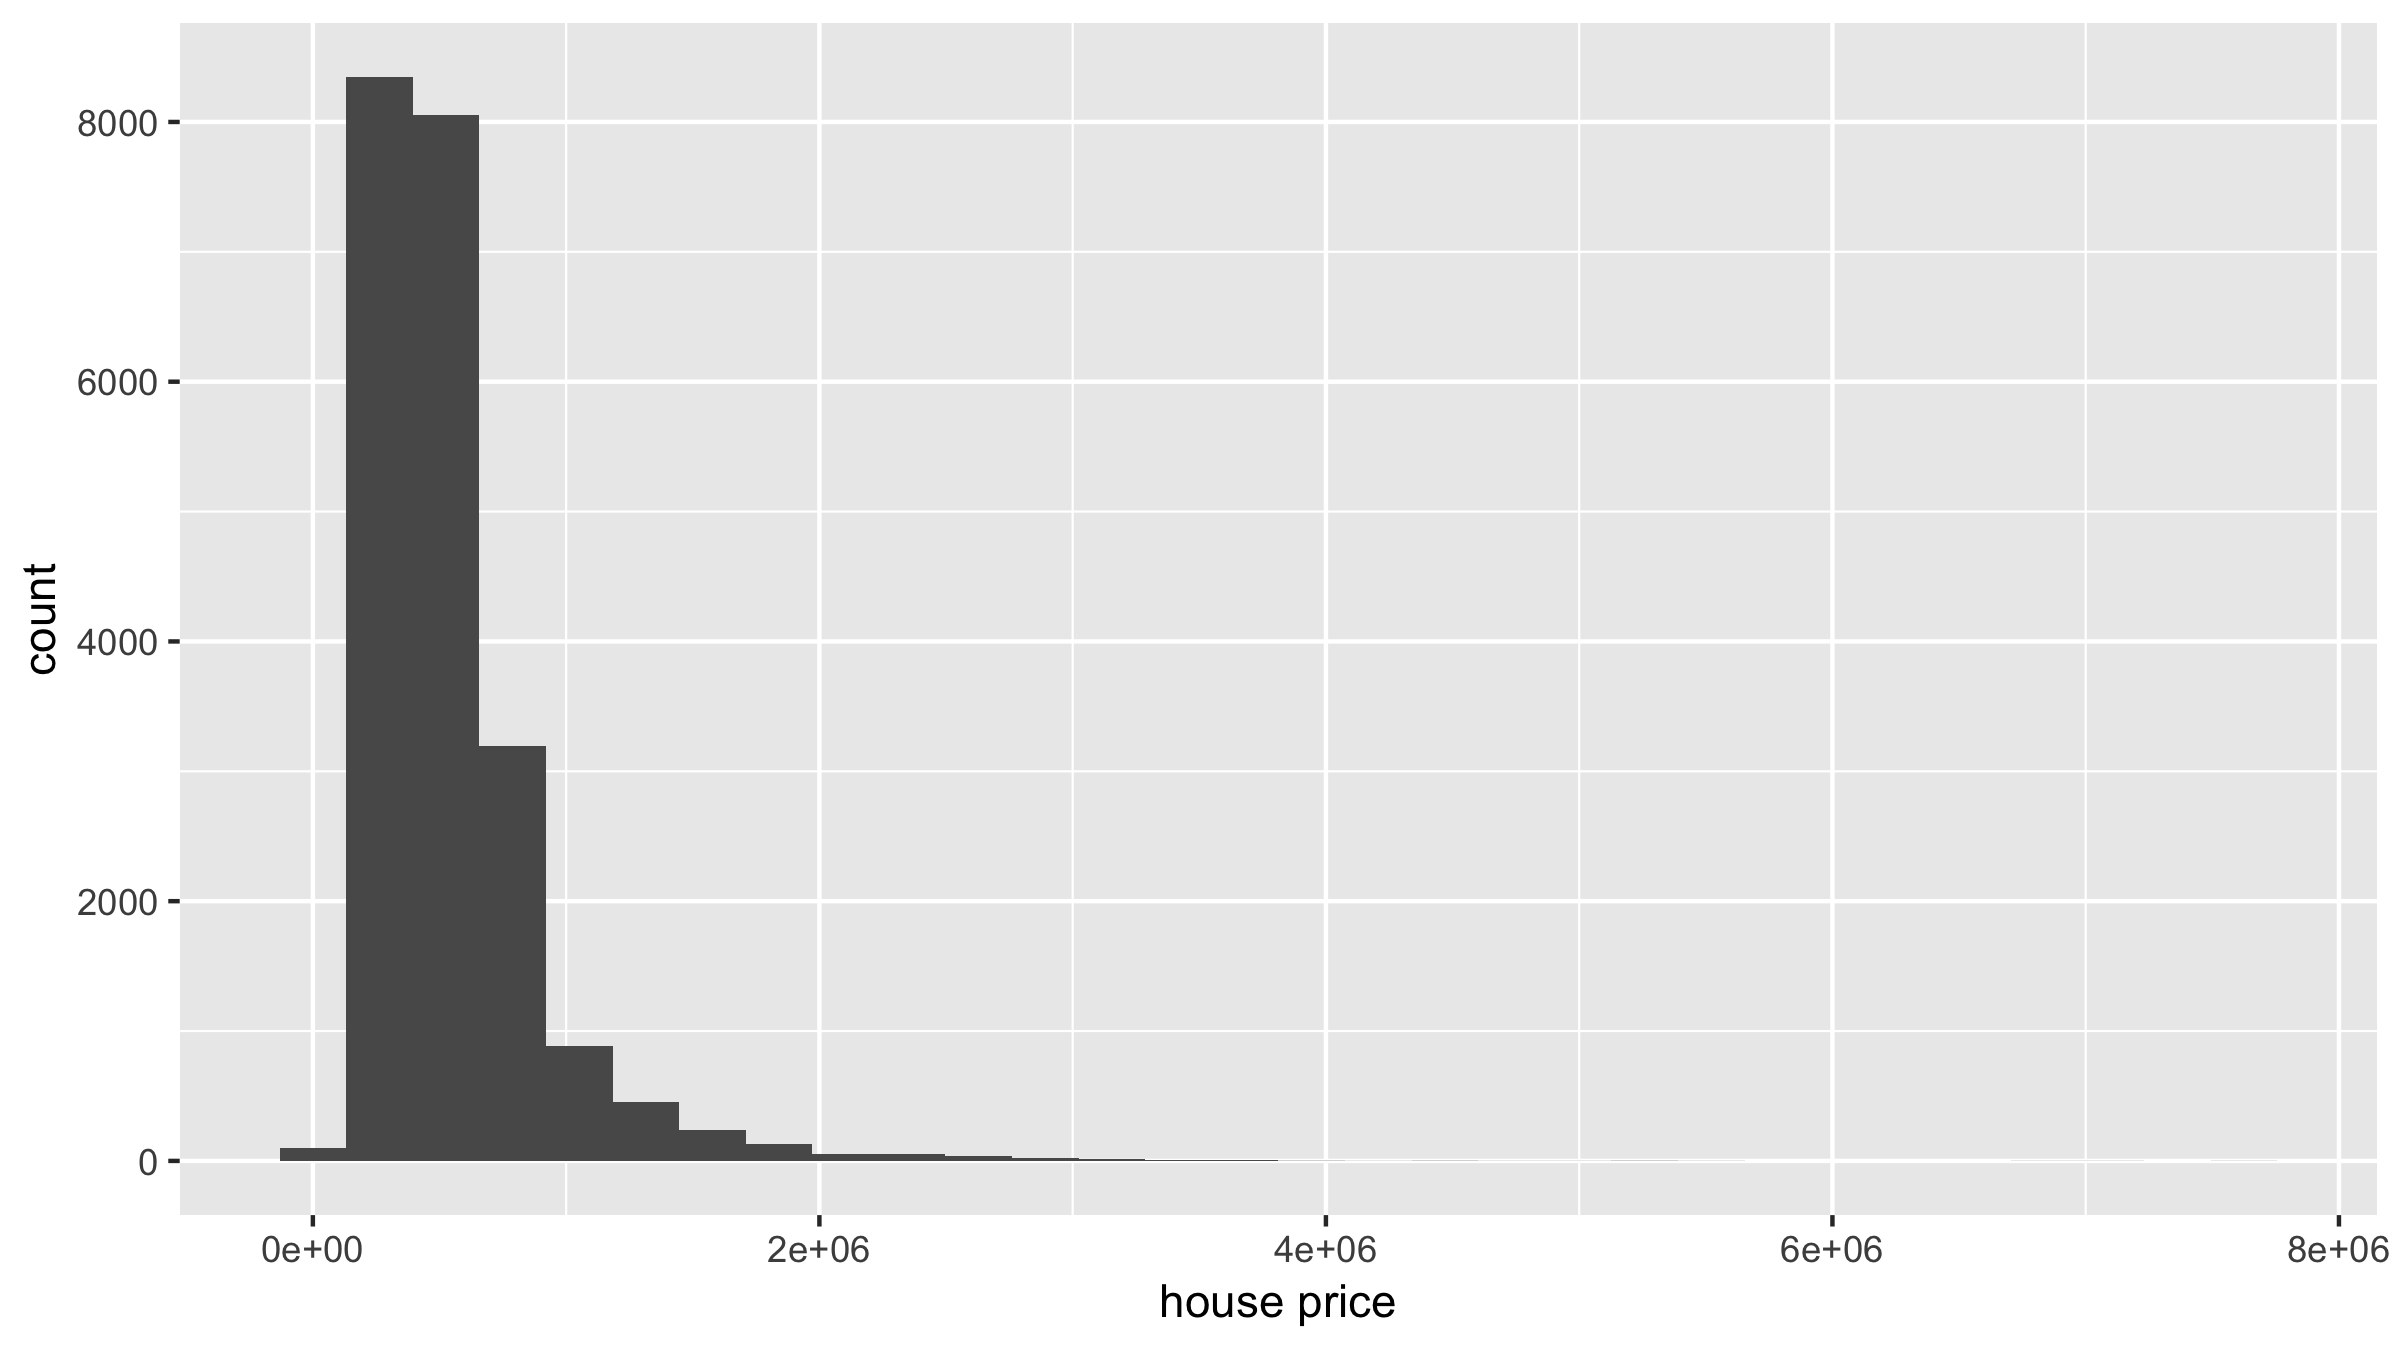
library(ggplot2)
ggplot(house_prices, aes(x = price)) +
  geom_histogram() +
  labs(x = "house price", y = "count")
# log10() transform price and size
house_prices <- house_prices %>%
  mutate(log10_price = log10(price)) %>%
  select(price, log10_price)
# A tibble: 21,613 x 2
     price log10_price
     <dbl>       <dbl>
 1  221900        5.35
 2  538000        5.73
 3  180000        5.26
 4  604000        5.78
 5  510000        5.71
 6 1225000        6.09
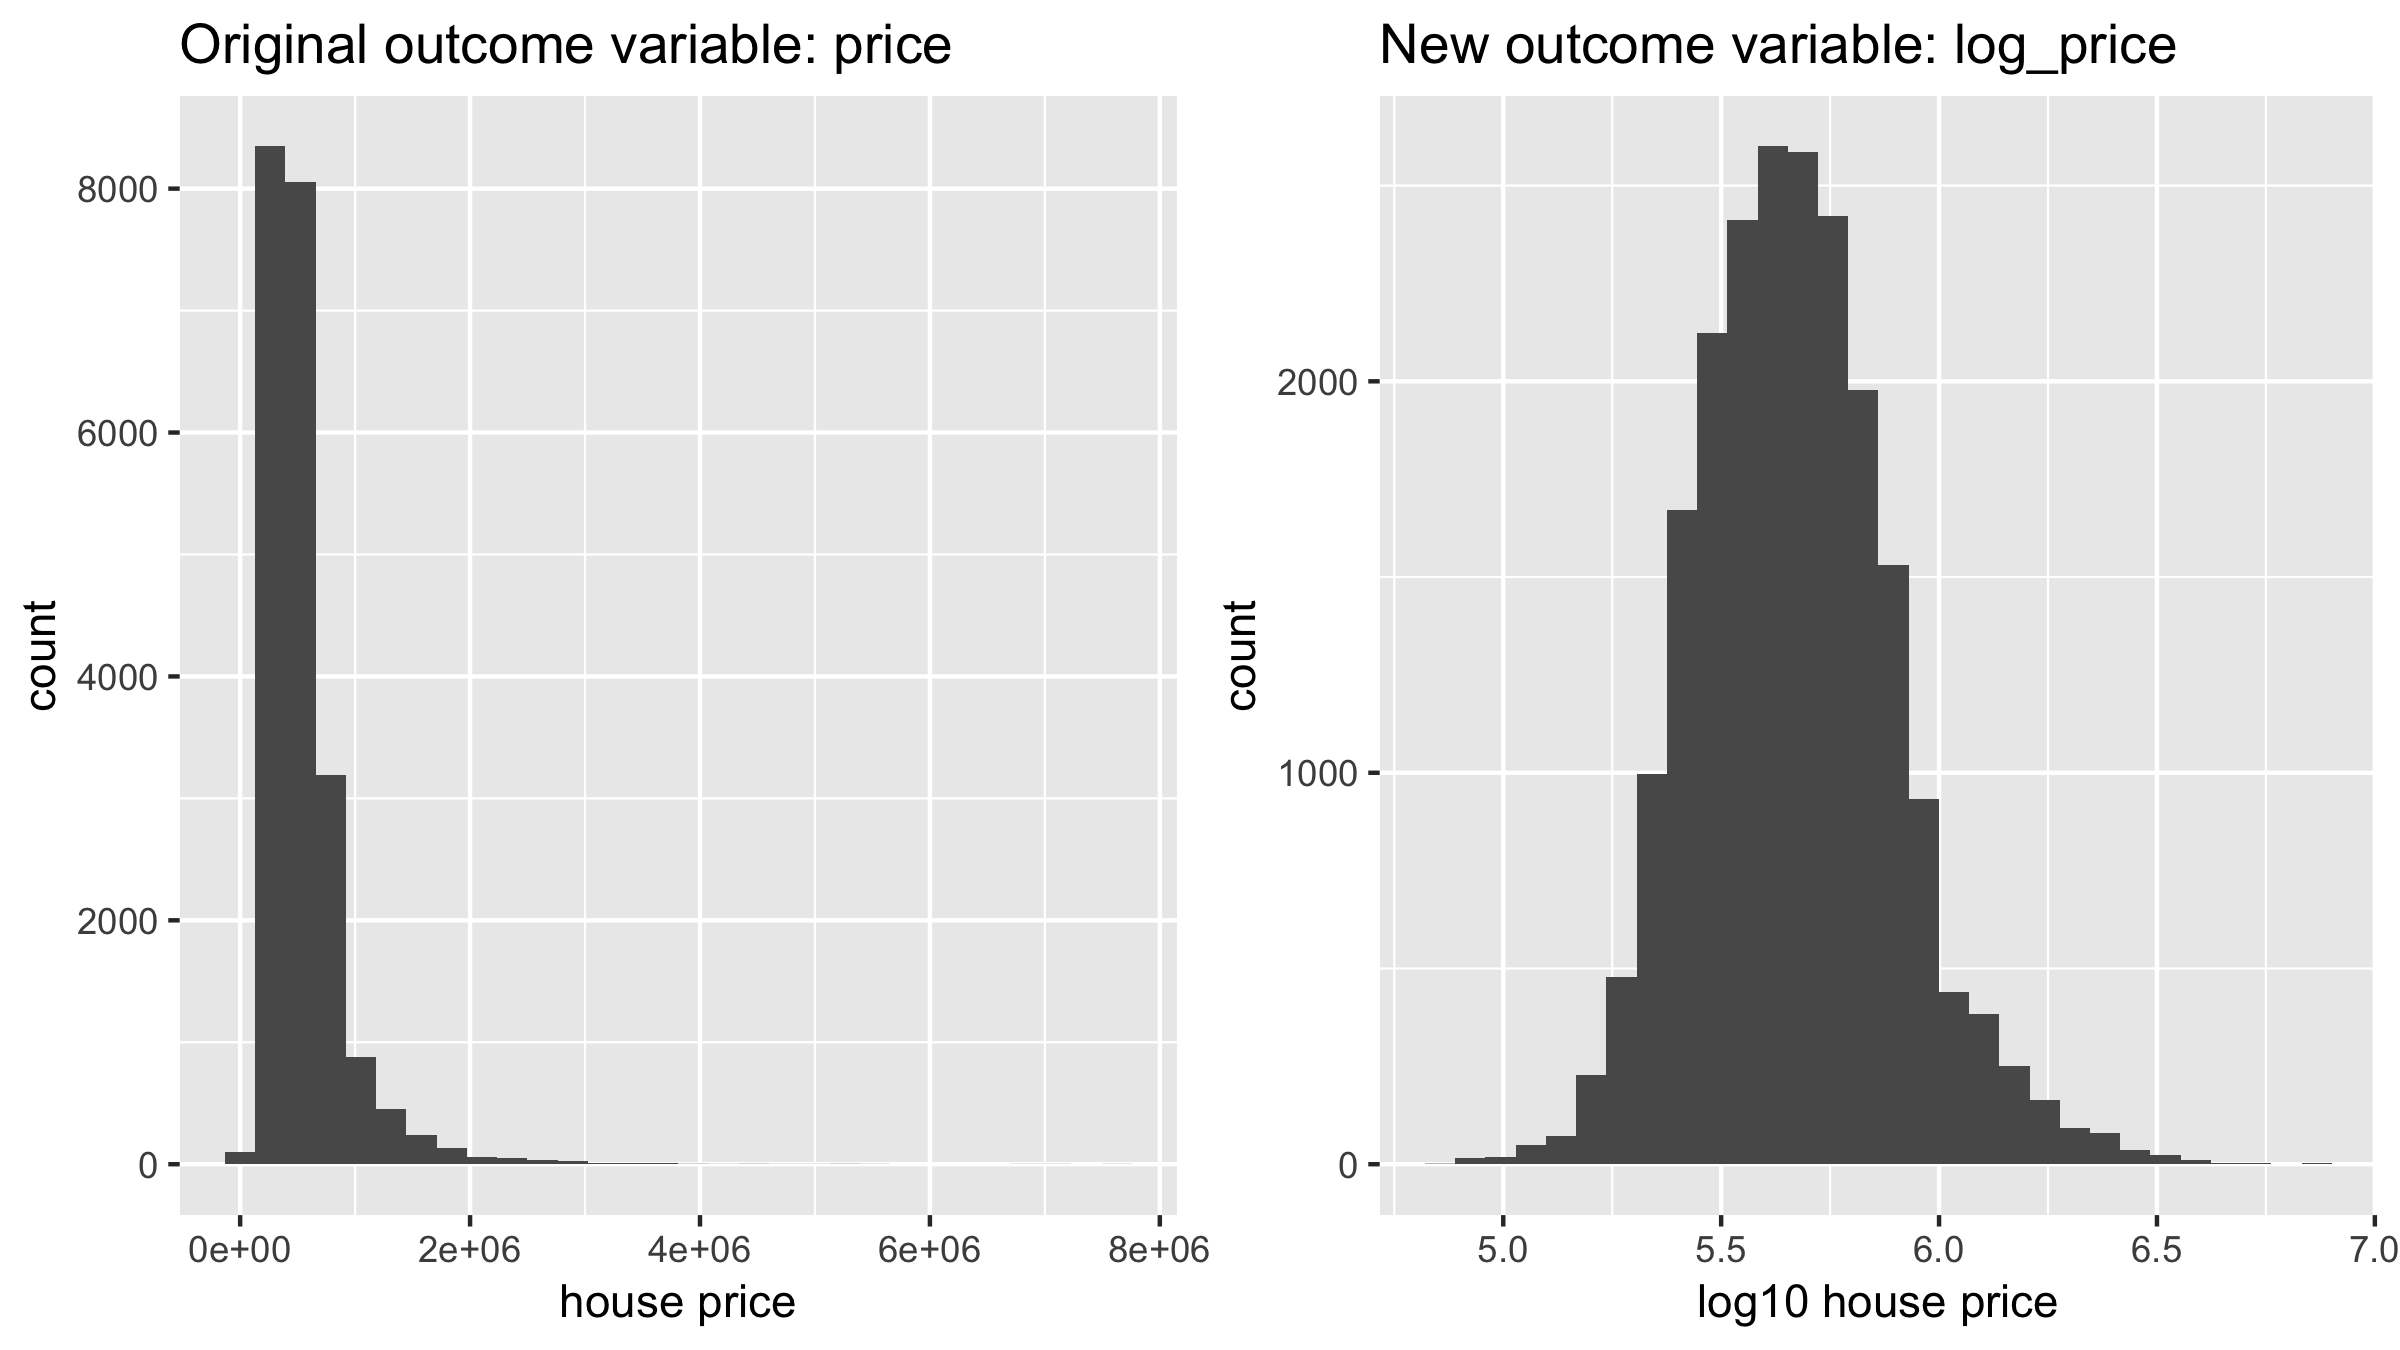
# Histogram of original outcome variable
ggplot(house_prices, aes(x = price)) +
  geom_histogram() +
  labs(x = "house price", y = "count")
# Histogram of new, log10-transformed outcome variable
ggplot(house_prices, aes(x = log10_price)) +
  geom_histogram() +
  labs(x = "log10 house price", y = "count")