Python으로 배우는 금융 분야 Machine Learning
Nathan George
Data Science Professor
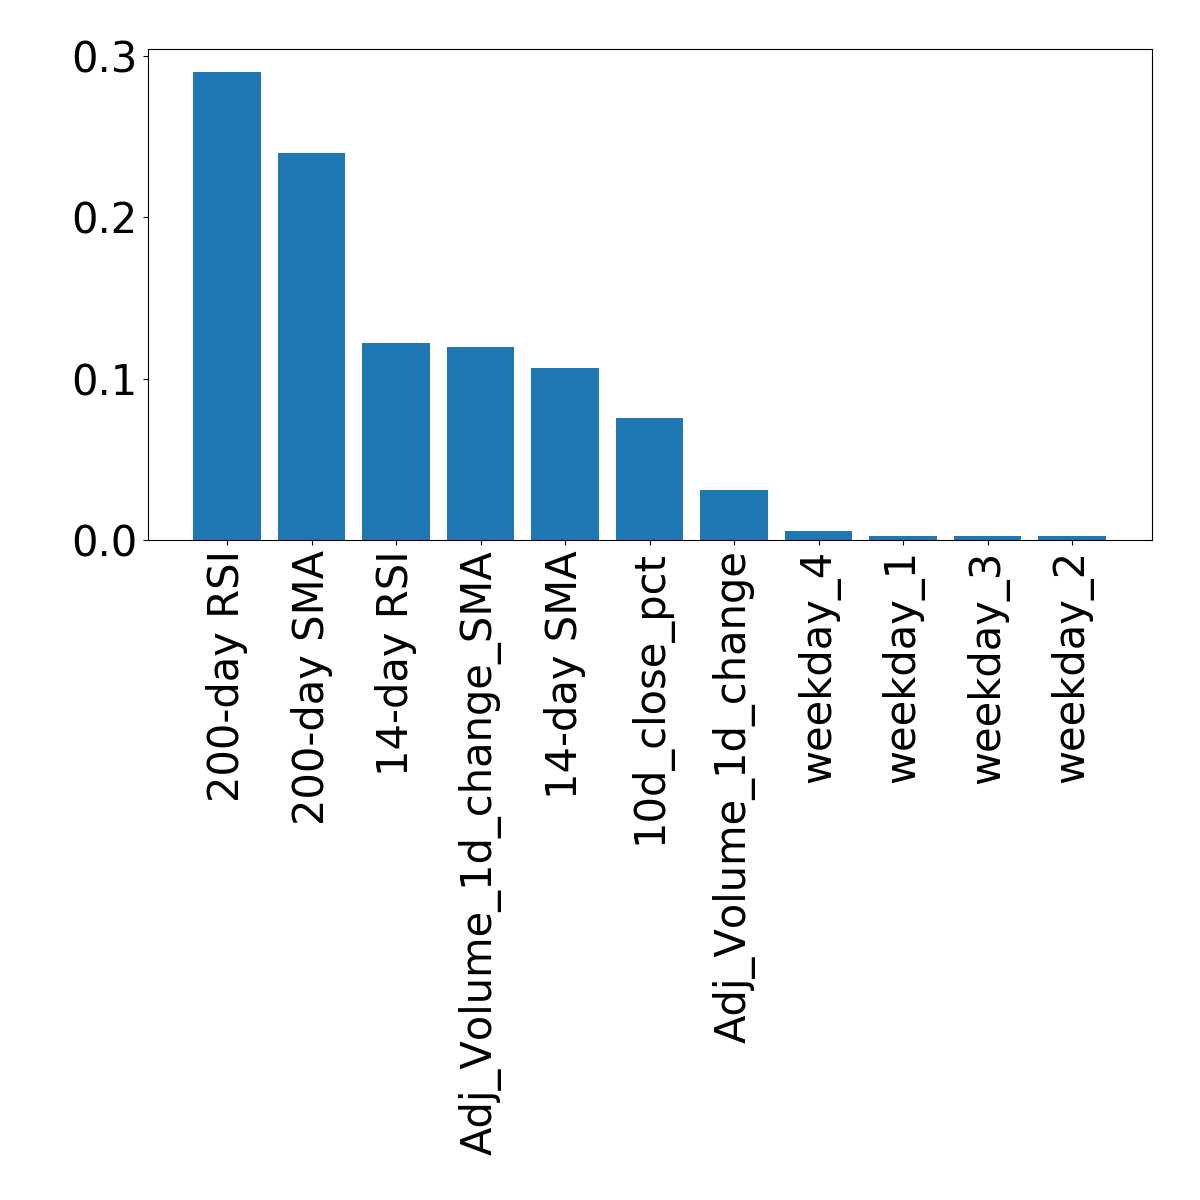
print(feature_names)
['10d_close_pct',
 '14-day SMA',
 '14-day RSI',
 '200-day SMA',
 '200-day RSI',
 'Adj_Volume_1d_change',
 'Adj_Volume_1d_change_SMA',
 'weekday_1',
 'weekday_2',
 'weekday_3',
 'weekday_4']
print(feature_names[:-4])
['10d_close_pct',
 '14-day SMA',
 '14-day RSI',
 '200-day SMA',
 '200-day RSI',
 'Adj_Volume_1d_change',
 'Adj_Volume_1d_change_SMA']
train_features = train_features.iloc[:, :-4]
test_features = test_features.iloc[:, :-4]
스케일링 방법:
from sklearn.preprocessing import scale

sc = scale()
scaled_train_features = sc.fit_transform(train_features)
scaled_test_features = sc.transform(test_features)
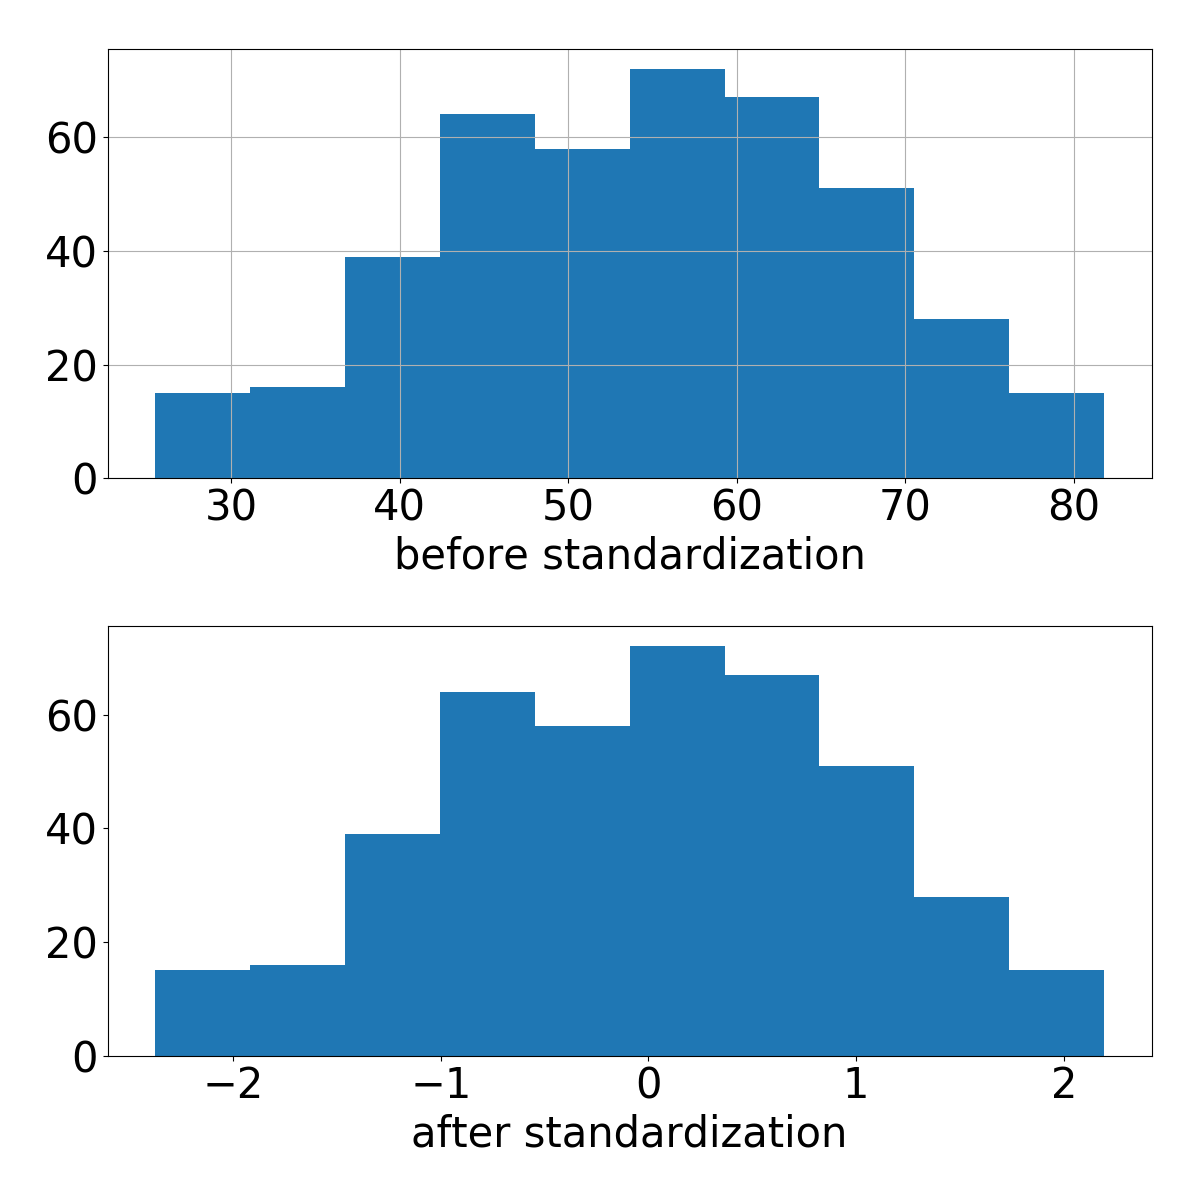
# create figure and list containing axes
f, ax = plt.subplots(nrows=2, ncols=1)

# plot histograms of before and after scaling
train_features.iloc[:, 2].hist(ax=ax[0])
ax[1].hist(scaled_train_features[:, 2])
plt.show()
# create figure and list containing axes f, ax = plt.subplots(nrows=2, ncols=1)
# plot histograms of before and after scaling train_features.iloc[:, 2].hist(ax=ax[0]) ax[1].hist(scaled_train_features[:, 2]) plt.show()