Python으로 시계열 데이터 시각화
Thomas Vincent
Head of Data Science, Getty Images
t_1
t_2
t_3
t_4
t_5
t_6
statsmodels는 다양한 통계 모델 추정, 통계 검정, 통계적 데이터 탐색을 위한 클래스와 함수를 제공하는 파이썬 모듈입니다.
statsmodels
import matplotlib.pyplot as plt
from statsmodels.graphics import tsaplots
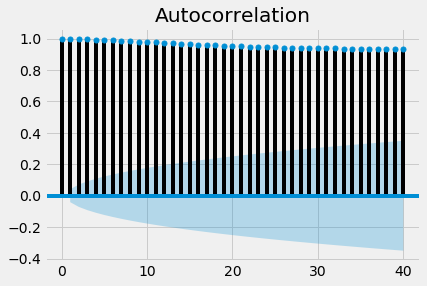
fig = tsaplots.plot_acf(co2_levels['co2'], lags=40)

plt.show()
order 3
t1
t2
t3
t4
t5
t6
import matplotlib.pyplot as plt

from statsmodels.graphics import tsaplots
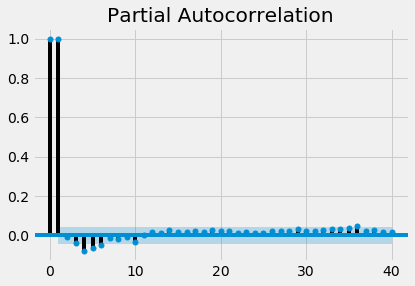
fig = tsaplots.plot_pacf(co2_levels['co2'], lags=40)

plt.show()