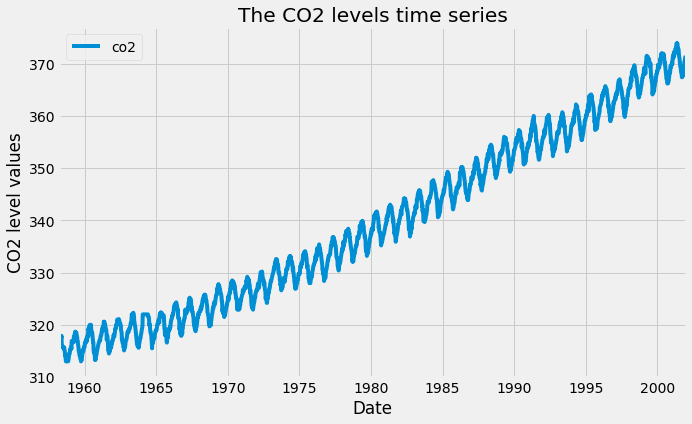
시계열 데이터의 계절성, 추세, 노이즈

Python으로 시계열 데이터 시각화

Thomas Vincent

Head of Data Science, Getty Images

시계열의 속성

시계열의 속성

Python으로 시계열 데이터 시각화

시계열의 속성

  • 계절성: 데이터에 명확한 주기적 패턴이 있습니까?
  • 추세: 데이터가 일관된 상승 또는 하락 추세를 따릅니까?
  • 노이즈: 나머지 데이터와 일치하지 않는 이상값이나 결측값이 있습니까?
Python으로 시계열 데이터 시각화

시계열 분해

import statsmodels.api as sm
import matplotlib.pyplot as plt
from pylab import rcParams

rcParams['figure.figsize'] = 11, 9
decomposition = sm.tsa.seasonal_decompose(
                co2_levels['co2'])
fig = decomposition.plot()

plt.show()
Python으로 시계열 데이터 시각화

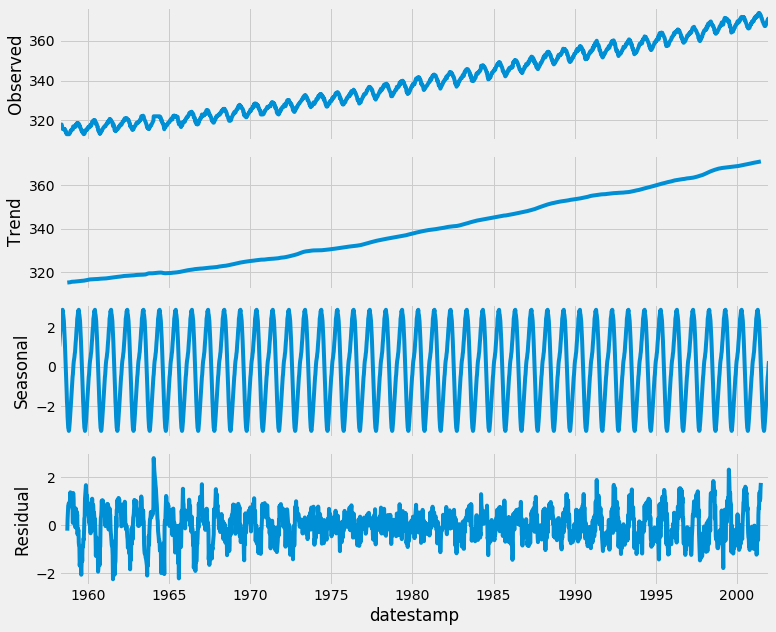
CO2 데이터의 시계열 분해 그래프

시계열 분해

Python으로 시계열 데이터 시각화

시계열 분해에서 성분 추출하기

print(dir(decomposition))
['__class__', '__delattr__', '__dict__',
 ... 'plot', 'resid', 'seasonal', 'trend']
print(decomposition.seasonal)
datestamp
1958-03-29    1.028042
1958-04-05    1.235242
1958-04-12    1.412344
1958-04-19    1.701186
Python으로 시계열 데이터 시각화

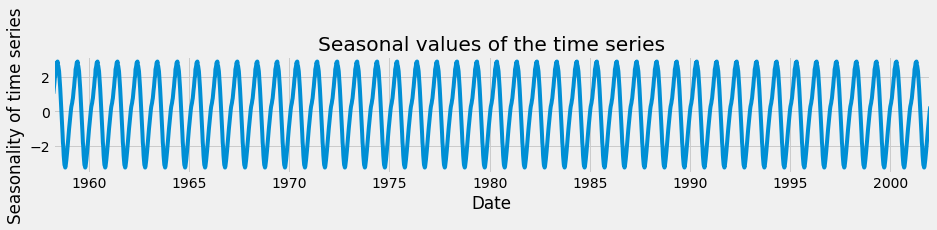
시계열의 계절성 성분

decomp_seasonal = decomposition.seasonal

ax = decomp_seasonal.plot(figsize=(14, 2))
ax.set_xlabel('Date')
ax.set_ylabel('Seasonality of time series')
ax.set_title('Seasonal values of the time series')

plt.show()
Python으로 시계열 데이터 시각화

시계열의 계절성 성분

시계열의 계절성

Python으로 시계열 데이터 시각화

시계열의 추세 성분

decomp_trend = decomposition.trend

ax = decomp_trend.plot(figsize=(14, 2))
ax.set_xlabel('Date')
ax.set_ylabel('Trend of time series')
ax.set_title('Trend values of the time series')

plt.show()
Python으로 시계열 데이터 시각화

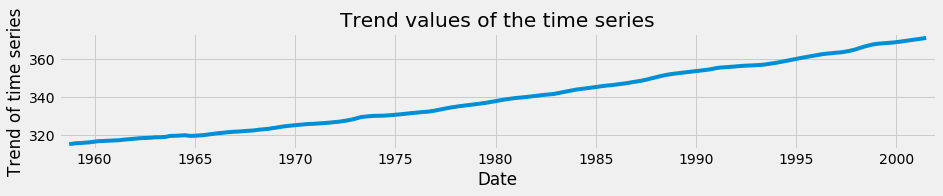
시계열의 추세 성분

시계열의 추세

Python으로 시계열 데이터 시각화

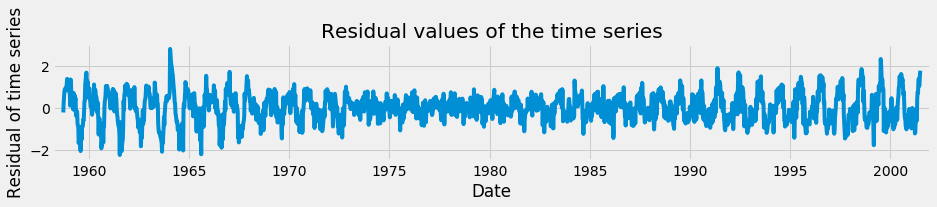
시계열의 노이즈 성분

decomp_resid = decomp.resid

ax = decomp_resid.plot(figsize=(14, 2))
ax.set_xlabel('Date')
ax.set_ylabel('Residual of time series')
ax.set_title('Residual values of the time series')

plt.show()
Python으로 시계열 데이터 시각화

시계열의 노이즈 성분

시계열의 노이즈

Python으로 시계열 데이터 시각화

연습해 봅시다!

Python으로 시계열 데이터 시각화

Preparing Video For Download...