두 개 이상의 시계열 다루기

Python으로 시계열 데이터 시각화

Thomas Vincent

Head of Data Science, Getty Images

다중 시계열 다루기

단일 시계열

date ts1
1949-01 112
1949-02 118
1949-03 132

다중 시계열 파일

date ts1 ts2 ts3 ts4 ts5 ts6 ts7
2012-01-01 2113.8 10.4 1987.0 12.1 3091.8 43.2 476.7
2012-02-01 2009.0 9.8 1882.9 12.3 2954.0 38.8 466.8
2012-03-01 2159.8 10.0 1987.9 14.3 3043.7 40.1 502.1
Python으로 시계열 데이터 시각화

육류 생산 데이터셋

import pandas as pd
meat = pd.read_csv("meat.csv")
print(meat.head(5))
         date   beef   veal    pork  lamb_and_mutton  broilers   
0  1944-01-01  751.0   85.0  1280.0             89.0       NaN 
1  1944-02-01  713.0   77.0  1169.0             72.0       NaN 
2  1944-03-01  741.0   90.0  1128.0             75.0       NaN 
3  1944-04-01  650.0   89.0   978.0             66.0       NaN 
4  1944-05-01  681.0  106.0  1029.0             78.0       NaN 

   other_chicken  turkey  
0            NaN     NaN  
1            NaN     NaN  
2            NaN     NaN  
3            NaN     NaN  
4            NaN     NaN
Python으로 시계열 데이터 시각화

다중 시계열 요약 및 시각화

import matplotlib.pyplot as plt
plt.style.use('fivethirtyeight')
ax = df.plot(figsize=(12, 4), fontsize=14)

plt.show()
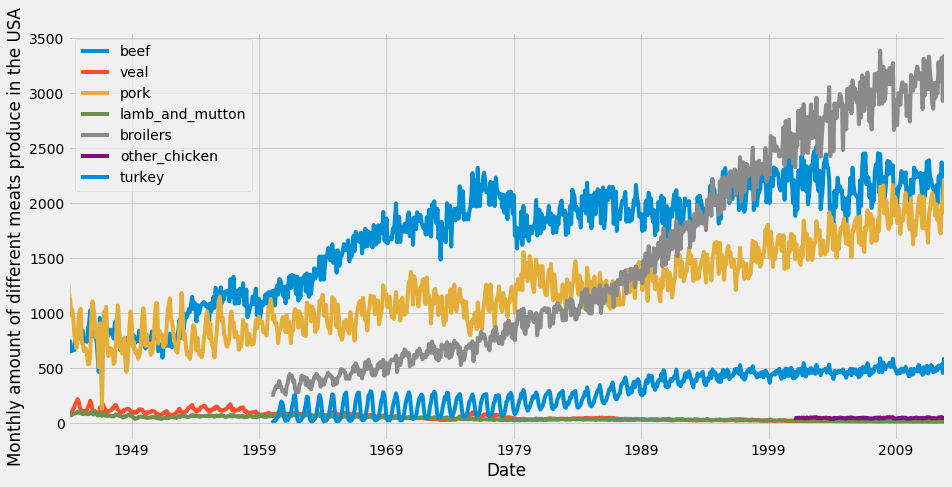
육류 생산 데이터셋

Python으로 시계열 데이터 시각화

면적 차트

import matplotlib.pyplot as plt
plt.style.use('fivethirtyeight')
ax = df.plot.area(figsize=(12, 4), fontsize=14)

plt.show()
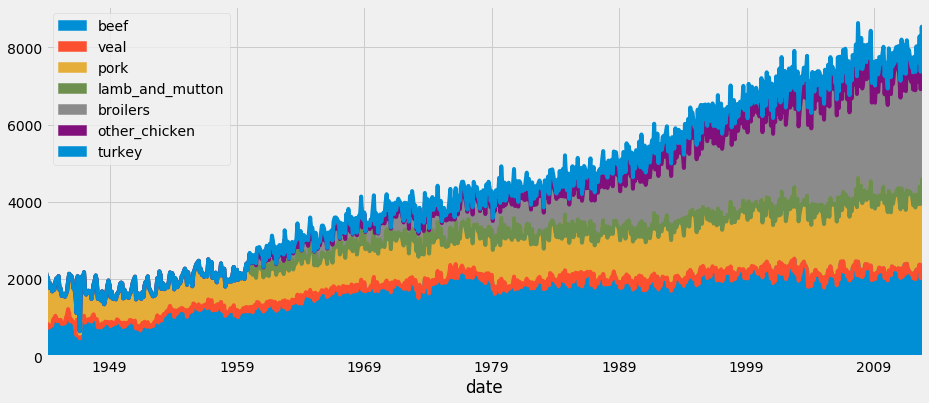
면적 차트로 나타낸 육류 생산 데이터셋

Python으로 시계열 데이터 시각화

연습해 봅시다!

Python으로 시계열 데이터 시각화

Preparing Video For Download...