GeoJSON으로 시각화

Python으로 지리공간 데이터 시각화하기

Mary van Valkenburg

Data Science Program Manager, Nashville Software School

동네 GeoJSON

{ "type": "FeatureCollection",
  "features": [
    { "type":"Feature",
      "properties":{
    "name":"Historic Buena Vista"
    },"geometry":{
        "type":"MultiPolygon","coordinates":[[[[-86.79511056795417,36.17575....
neighborhoods = gpd.read_file('./data/neighborhood_boundaries.geojson')
neighborhoods.head(1)
        name             geometry
Historic Buena Vista    (POLYGON ((-86.79511056795417 36.17575964963348...)))
Python으로 지리공간 데이터 시각화하기

Geopandas 의존성

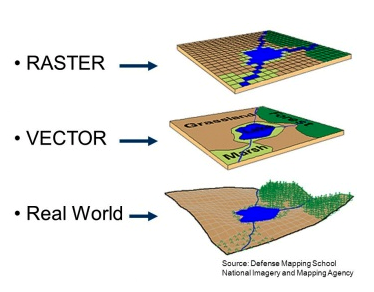
래스터 및 벡터 표현

  • Fiona
    • OGR의 Python API 제공
  • GDAL/OGR
    • GDAL: 래스터 데이터 변환
    • OGR: 벡터 데이터 변환
Python으로 지리공간 데이터 시각화하기

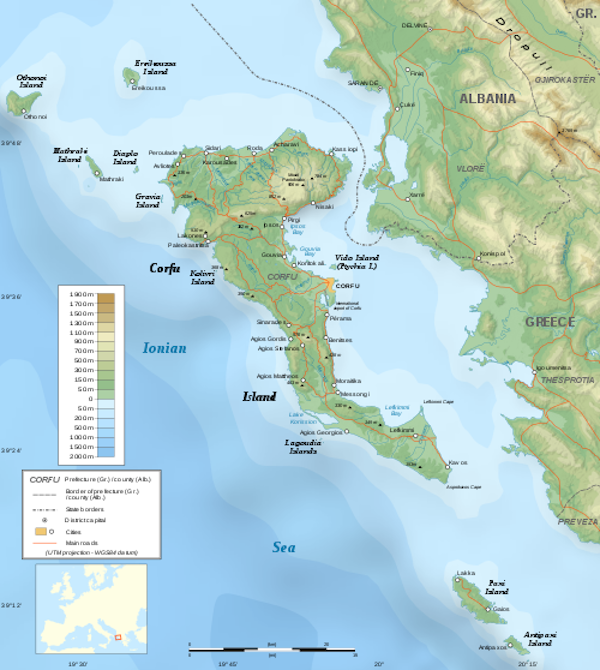
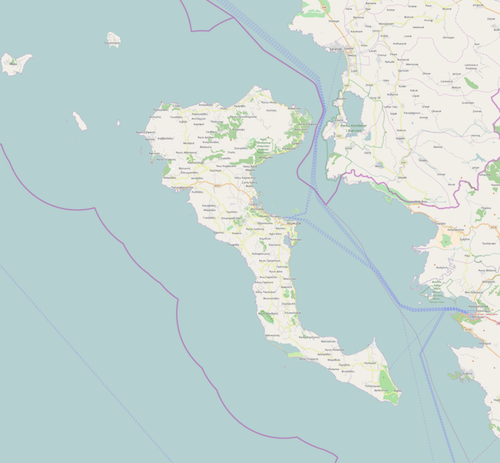
래스터와 벡터 그래픽 비교

코르푸의 래스터 이미지 코르푸의 래스터 이미지

코르푸의 벡터 이미지 코르푸의 벡터 이미지

Python으로 지리공간 데이터 시각화하기

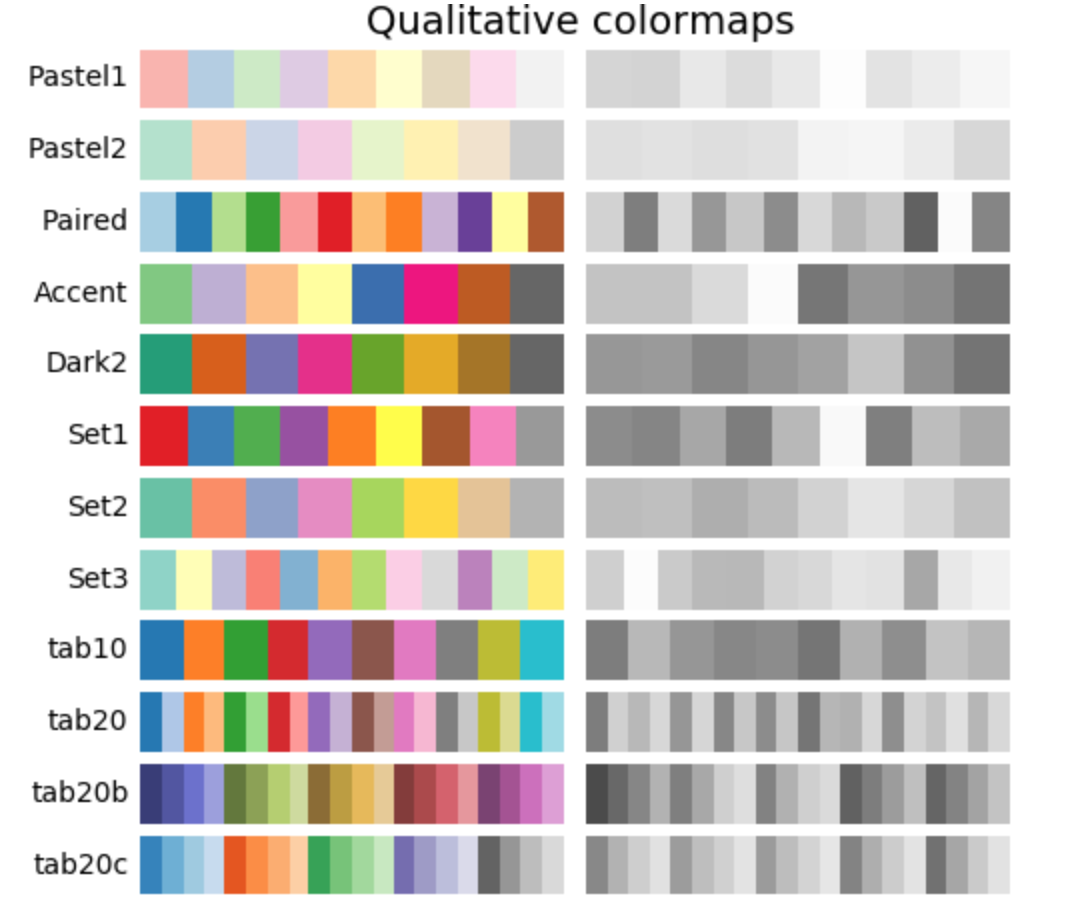
컬러맵

Python으로 지리공간 데이터 시각화하기

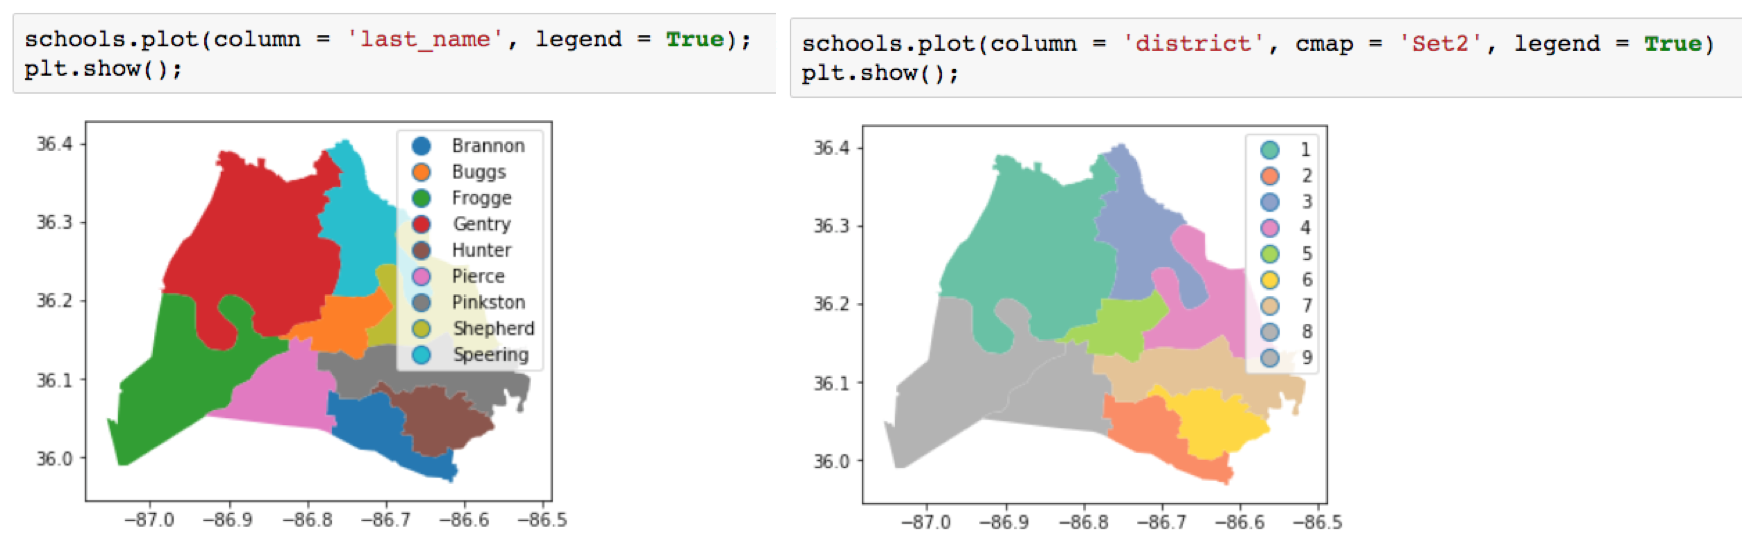
색상으로 시각화

school_districts.head(3)
first_name     last_name    position    district      geometry
Sharon         Gentry       Member       1    (POLYGON ((-86.771 36.383)...))
Jill           Speering     Vice-Chair   3    (POLYGON ((-86.753 36.404)...))
Jo Ann         Brannon      Member       2    (POLYGON ((-86.766 36.083)...))

컬러맵 비교

Python으로 지리공간 데이터 시각화하기
council_dists.plot(
                   column='district', 
                   cmap='Set3', 
                   legend=True)
plt.title('Council Districts')
plt.show();
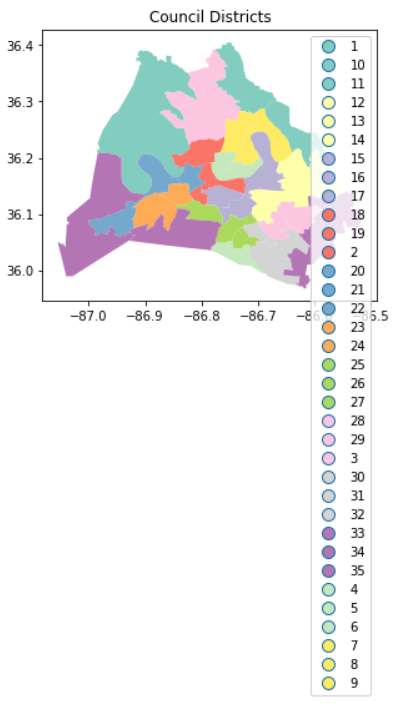
긴 범례가 있는 의회 구역 플롯

leg_kwds={'title':'District Number', 
          'loc': 'upper left', 
          'bbox_to_anchor':(1, 1.03), 
          'ncol':3}
council_dists.plot(column='district', 
                   cmap='Set3',
                   legend=True, 
             legend_kwds=leg_kwds)
plt.title('Council Districts')
plt.show();
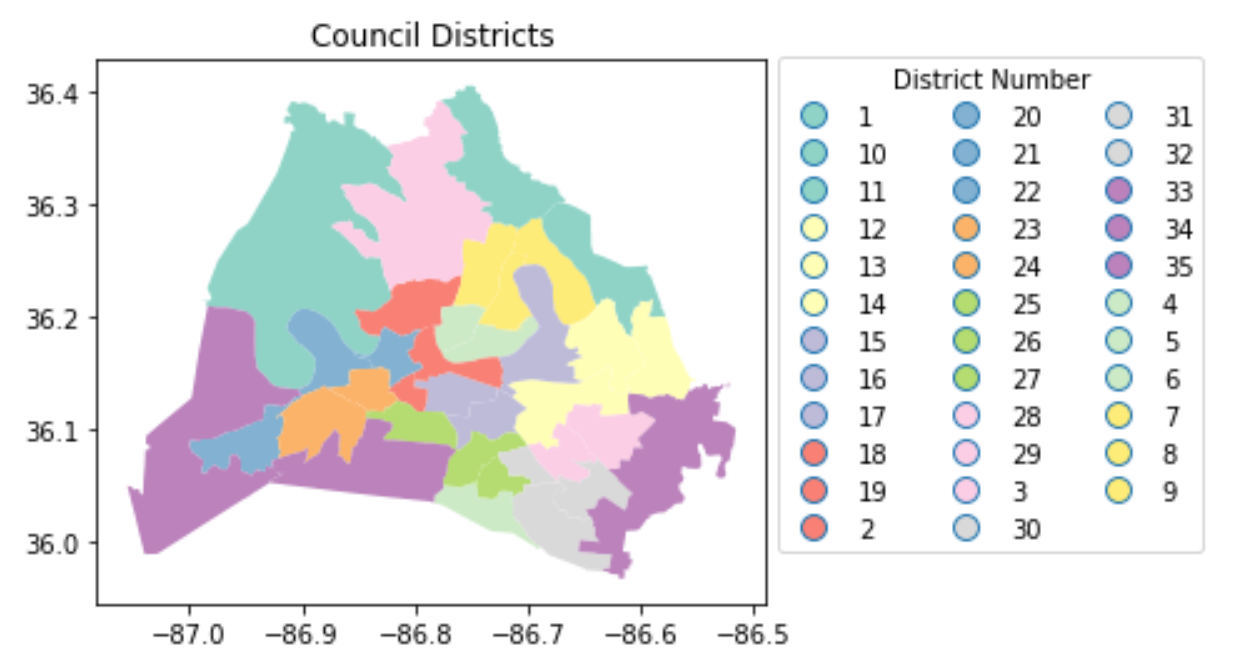
다중 열 범례가 있는 의회 구역 플롯

Python으로 지리공간 데이터 시각화하기

연습해 봅시다!

Python으로 지리공간 데이터 시각화하기

Preparing Video For Download...