Python을 활용한 생의학 영상 분석
Stephen Bailey
Instructor
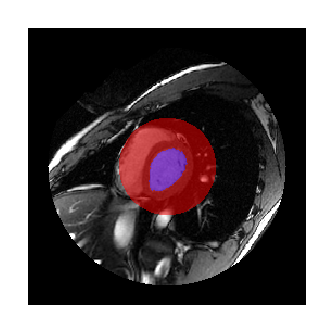
심장 시계열의 단일 볼륨에 대해 다음 레이블이 있습니다:

scipy.ndimage.measurements
ndi.mean()
ndi.median()
ndi.sum()
ndi.maximum()
ndi.standard_deviation()
ndi.variance()
전체 차원에 적용되며, 특정 레이블에 선택적으로 적용 가능합니다.
사용자 정의 함수:
ndi.labeled_comprehension()
import imageio.v2 as imageio import scipy.ndimage as ndi vol=imageio.volread('SCD-3d.npz') label=imageio.volread('labels.npz')# All pixels ndi.mean(vol)
3.7892
# Labeled pixels
ndi.mean(vol, label)
89.2342
# Label 1
ndi.mean(vol, label, index=1)
163.2930
# Labels 1 and 2
ndi.mean(vol, label, index=[1,2])
[163.2930, 60.2847]
hist=ndi.histogram(vol, min=0, max=255, bins=256)obj_hists=ndi.histogram(vol, 0, 255, 256, labels, index=[1, 2]) len(obj_hists)
2
plt.plot(obj_hists[0],
label='Left ventricle')
plt.plot(obj_hists[1],
label='Other labelled pixels')
plt.legend()
plt.show()
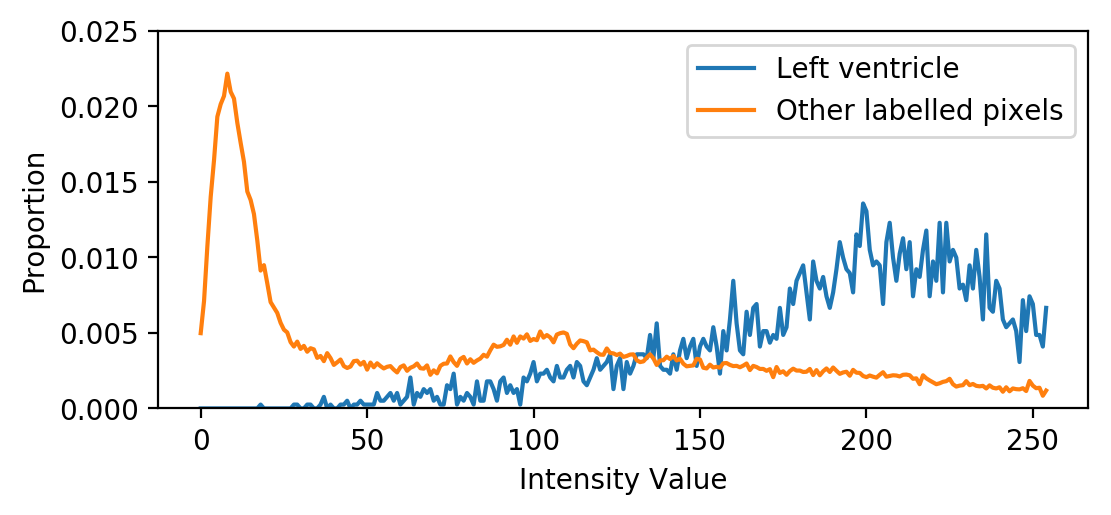
여러 조직 유형을 포함하는 히스토그램은 여러 개의 피크를 가집니다
잘 분할된 조직의 히스토그램은 정규 분포와 유사합니다
Python을 활용한 생의학 영상 분석