JointGrid와 jointplot 사용하기

Seaborn으로 배우는 중급 데이터 시각화

Chris Moffitt

Instructor

JointGrid() 개요
JointGrid 개요

Seaborn으로 배우는 중급 데이터 시각화

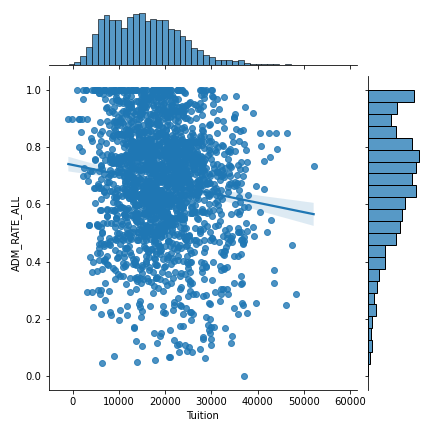
기본 JointGrid

g = sns.JointGrid(data=df, x="Tuition", y="ADM_RATE_ALL") 
g.plot(sns.regplot, sns.histplot)

JointGrid 예제

Seaborn으로 배우는 중급 데이터 시각화

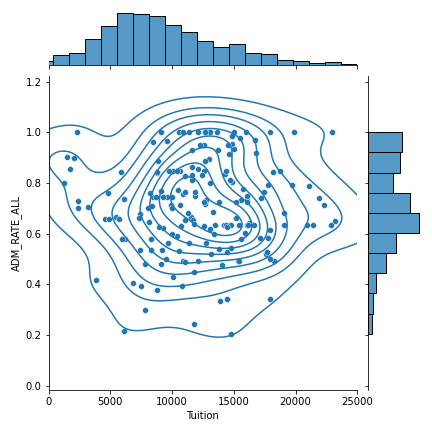
고급 JointGrid

g = sns.JointGrid(data=df, x="Tuition", y="ADM_RATE_ALL") 
g = g.plot_joint(sns.kdeplot)
g = g.plot_marginals(sns.kdeplot, shade=True)

JointGrid 예제 주석

Seaborn으로 배우는 중급 데이터 시각화

jointplot()

sns.jointplot(data=df, x="Tuition", y="ADM_RATE_ALL", kind='hex')
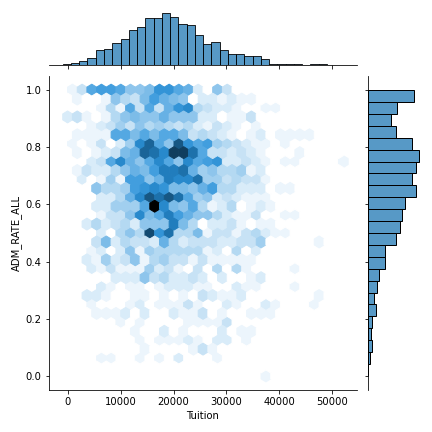
jointplot 예제

Seaborn으로 배우는 중급 데이터 시각화

jointplot 커스터마이징

g = (sns.jointplot(x="Tuition",
                   y="ADM_RATE_ALL",
                   kind="scatter",
                   xlim=(0, 25000),
                   data=df.query('UG < 2500 &
                   Ownership == "Public"'))
    .plot_joint(sns.kdeplot))
Seaborn으로 배우는 중급 데이터 시각화

jointplot 커스터마이징

jointplot

Seaborn으로 배우는 중급 데이터 시각화

연습해 봅시다!

Seaborn으로 배우는 중급 데이터 시각화

Preparing Video For Download...