이상치 탐지를 위한 시계열 분해

Python으로 배우는 이상치 탐지

Bekhruz (Bex) Tuychiev

Kaggle Master, Data Science Content Creator

계절성
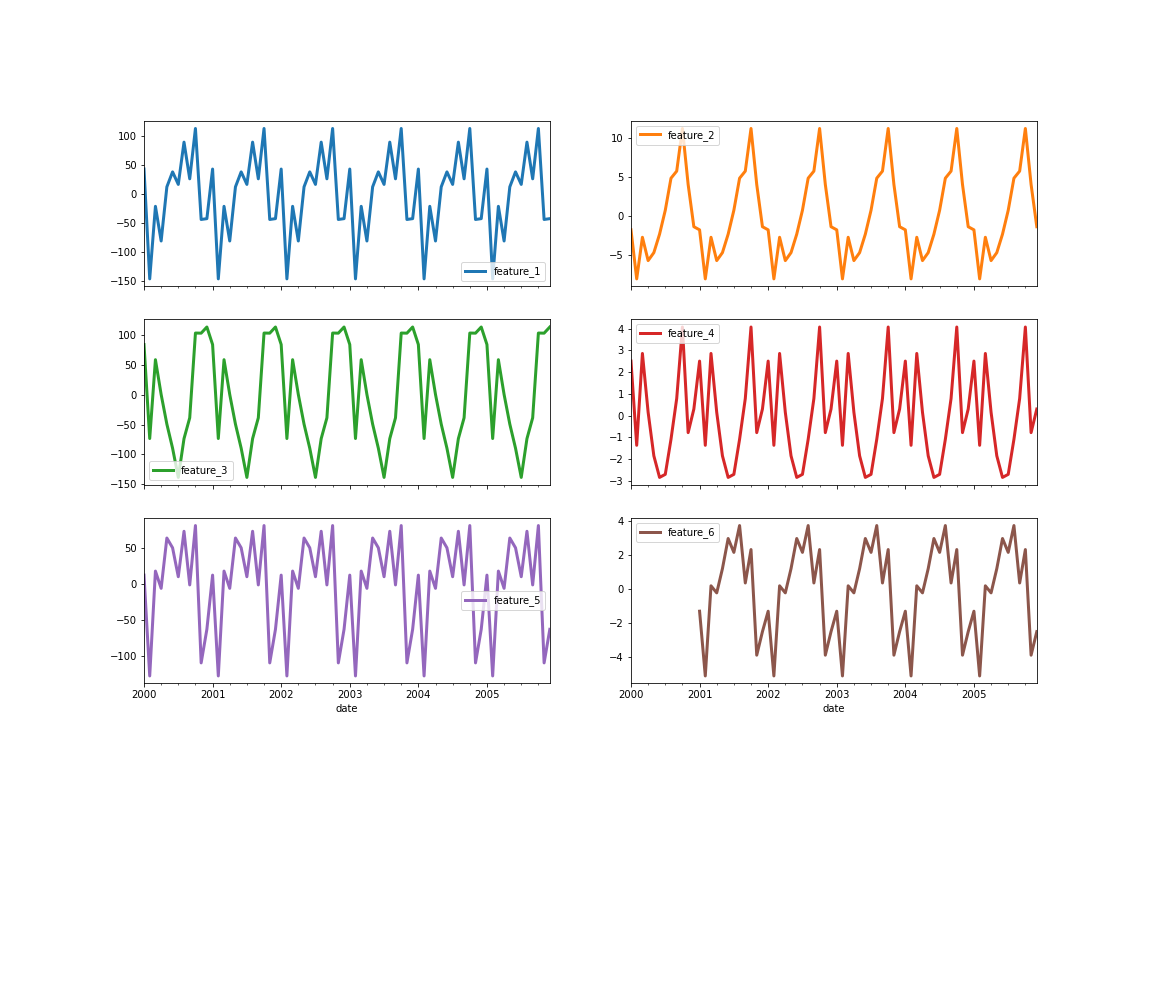
  • 시계열의 반복 패턴
  • 고정 주기:
    • 매시간
    • 매일
    • 매주
    • 매월 등
  • 예:
    • 일일 기온
    • 아이스크림 판매량
Python으로 배우는 이상치 탐지

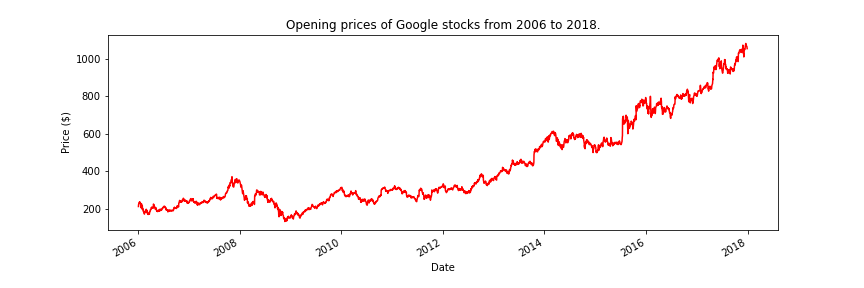
계절성

Google 주가 시가의 꺾은선 플롯.

Python으로 배우는 이상치 탐지

seasonal_decompose

from statsmodels.tsa.seasonal import seasonal_decompose

results = seasonal_decompose(google['Open'], period=365)

print(results)
<statsmodels.tsa.seasonal.DecomposeResult object at 0x7f0a67fac820>
Python으로 배우는 이상치 탐지

계절성 플로팅

results.seasonal.plot(color="red", figsize=(12, 4))
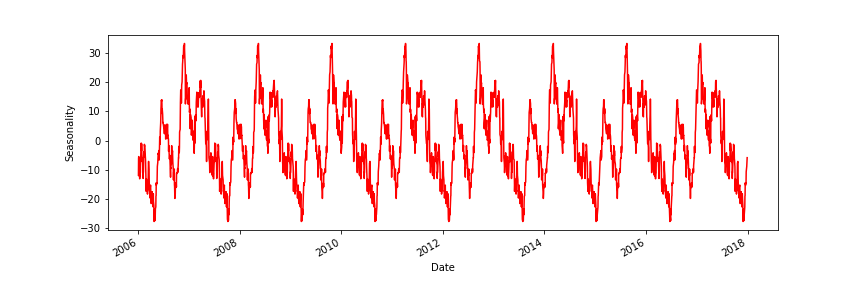
Google 주가 시가의 계절성 플롯

Python으로 배우는 이상치 탐지

계절성 예시

시계열 계절성 예시.

Python으로 배우는 이상치 탐지

주가 초기 플롯

Google 주가 시가의 초기 플롯

Python으로 배우는 이상치 탐지

추세

results.trend.plot(color="red", figsize=(12, 4))

Python으로 배우는 이상치 탐지

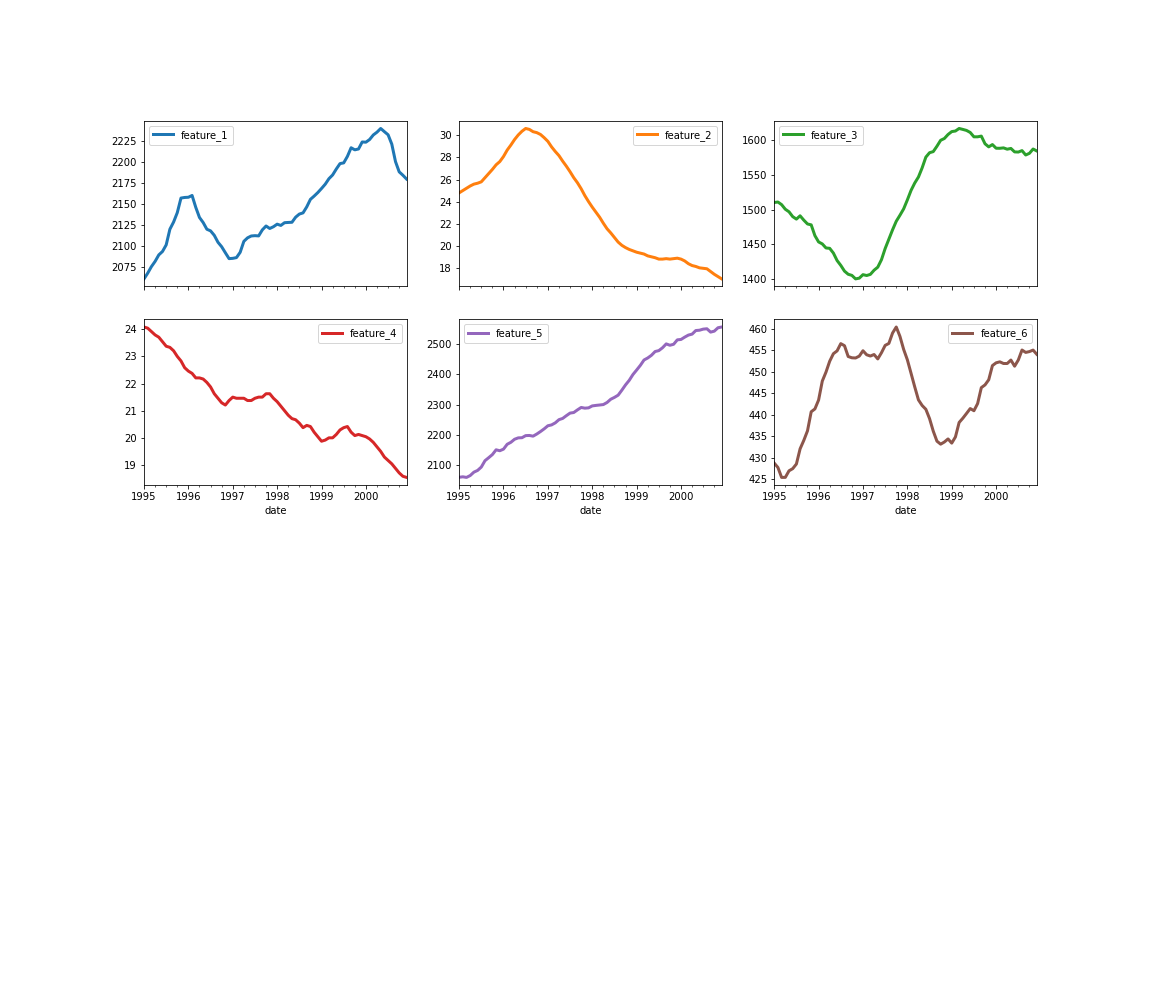
추세 예시

시계열 추세 예시.

Python으로 배우는 이상치 탐지

잔차

results.resid.plot(color="red", figsize=(12, 4))
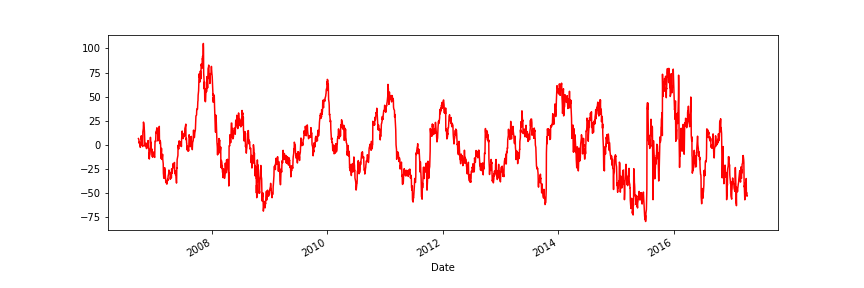
Google 주가 시가의 잔차 플롯.

Python으로 배우는 이상치 탐지

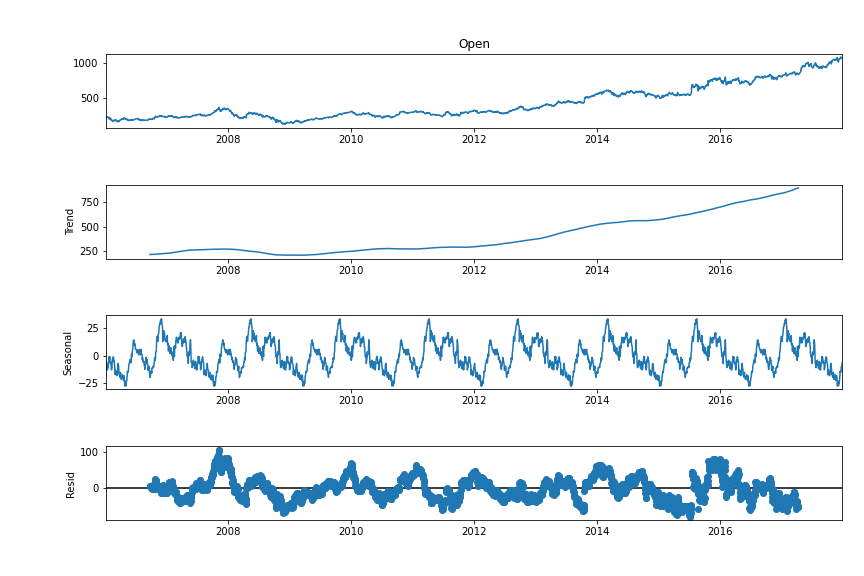
분해

figure = results.plot()

figure.set_figwidth(12)
figure.set_figheight(8)

시계열의 세 구성요소 시각화.

Python으로 배우는 이상치 탐지

분류기 학습

# 잔차 추출 및 재구성
results = seasonal_decompose(google['Volume'], period=365)
residuals = results.resid
residuals = residuals.values.reshape(-1, 1)


# MAD 학습 mad = MAD().fit(residuals)
# 이상치 찾기 is_outlier = mad.labels_ == 1 outliers = google[is_outlier] print(len(outliers))
81
Python으로 배우는 이상치 탐지

Ayo berlatih!

Python으로 배우는 이상치 탐지

Preparing Video For Download...