요약 데이터 정렬 및 필터링

사례 연구: R로 하는 탐색적 데이터 분석

Dave Robinson

Chief Data Scientist, DataCamp

by_country 데이터셋

by_country
# A tibble: 200 × 3
               country total percent_yes
                 <chr> <int>       <dbl>
1          Afghanistan  2373   0.8592499
2              Albania  1695   0.7174041
3              Algeria  2213   0.8992318
4              Andorra   719   0.6383866
5               Angola  1431   0.9238295
6  Antigua and Barbuda  1302   0.9124424
7            Argentina  2553   0.7677242
8              Armenia   758   0.7467018
9            Australia  2575   0.5565049
10             Austria  2389   0.6224362
# ... with 190 more rows
사례 연구: R로 하는 탐색적 데이터 분석

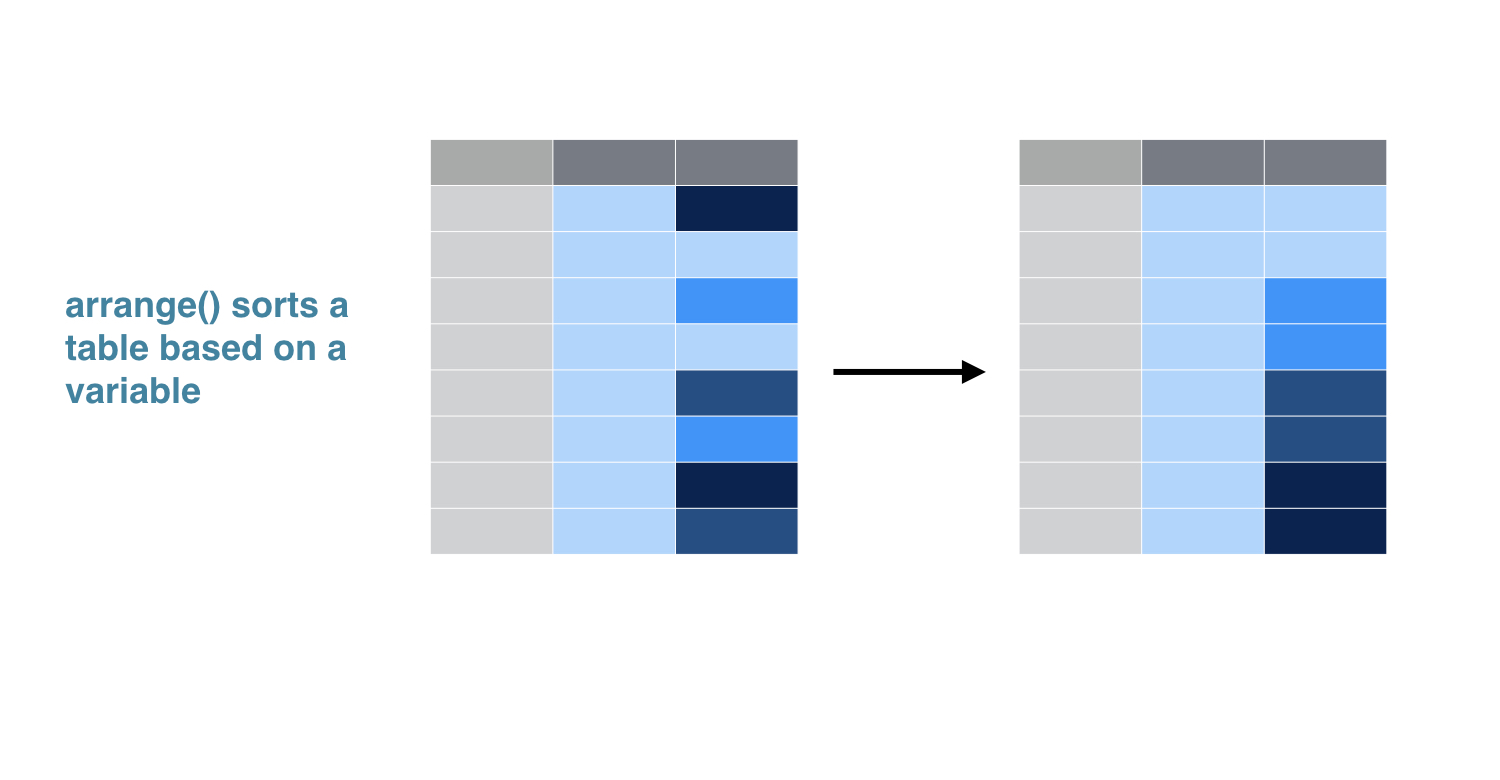
dplyr 동사: arrange()

1-3.004.png

사례 연구: R로 하는 탐색적 데이터 분석

arrange()

by_country %>%
  arrange(percent_yes)
# A tibble: 200 × 3
                           country total percent_yes
                             <chr> <int>       <dbl>
1                         Zanzibar     2   0.0000000
2                    United States  2568   0.2694704
3                            Palau   369   0.3387534
4                           Israel  2380   0.3407563
5      Federal Republic of Germany  1075   0.3972093
6                   United Kingdom  2558   0.4167318
7                           France  2527   0.4265928
8  Micronesia, Federated States of   724   0.4419890
9                 Marshall Islands   757   0.4914135
10                         Belgium  2568   0.4922118
# ... with 190 more rows
사례 연구: R로 하는 탐색적 데이터 분석

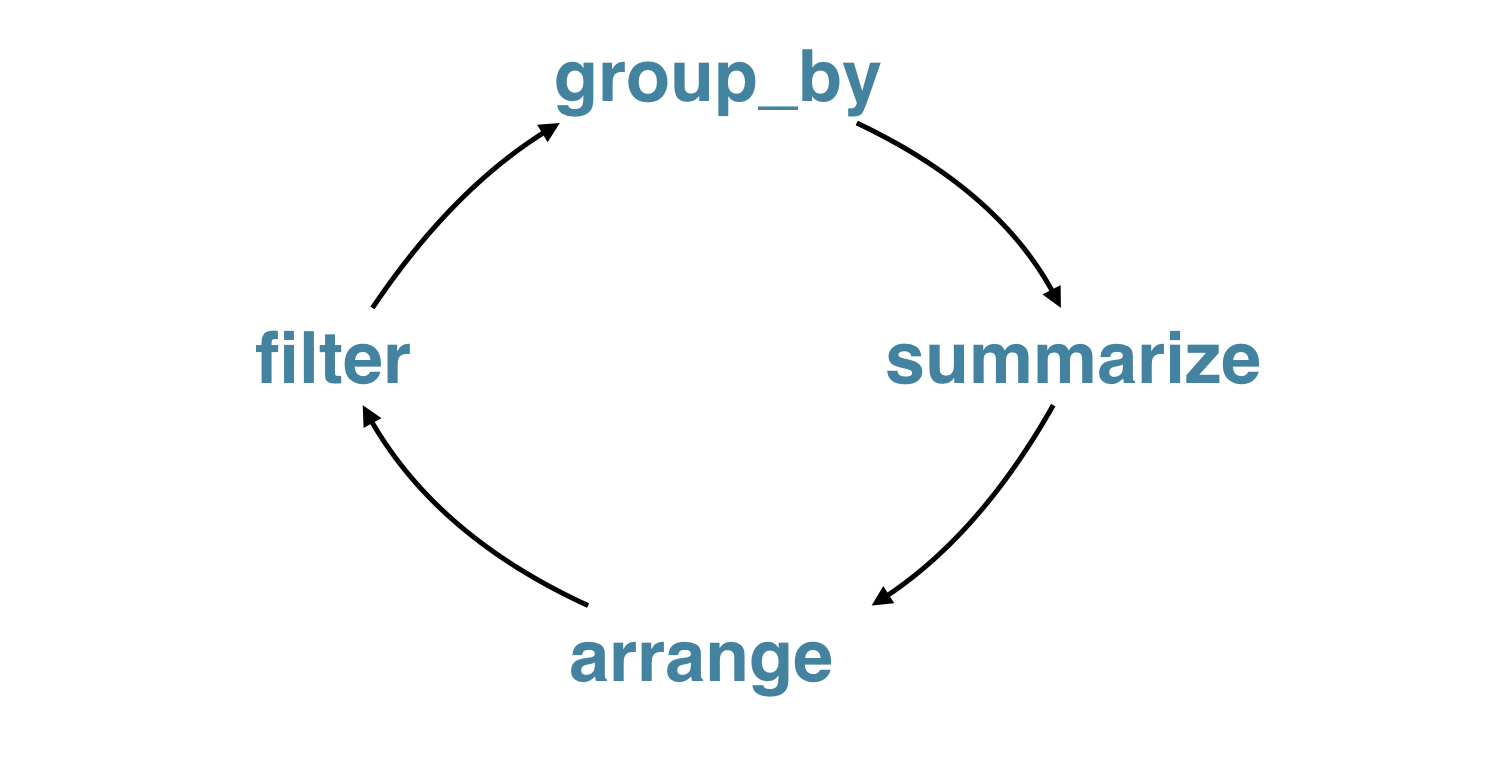
정돈된 데이터 변환

1-3.010.png

사례 연구: R로 하는 탐색적 데이터 분석

연습해 봅시다!

사례 연구: R로 하는 탐색적 데이터 분석

Preparing Video For Download...