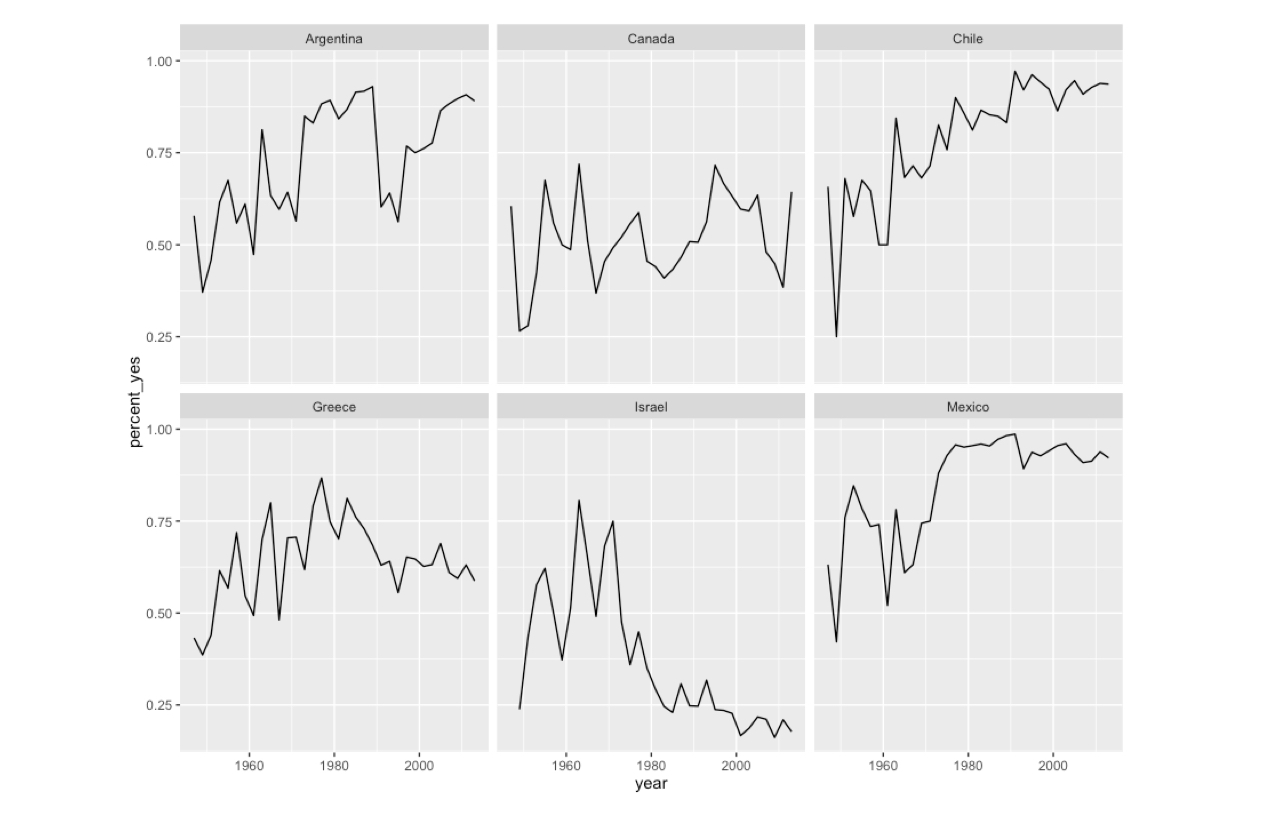
국가별 패싯
사례 연구: R로 하는 탐색적 데이터 분석

Dave Robinson
Chief Data Scientist, DataCamp
여러 국가 그래프화
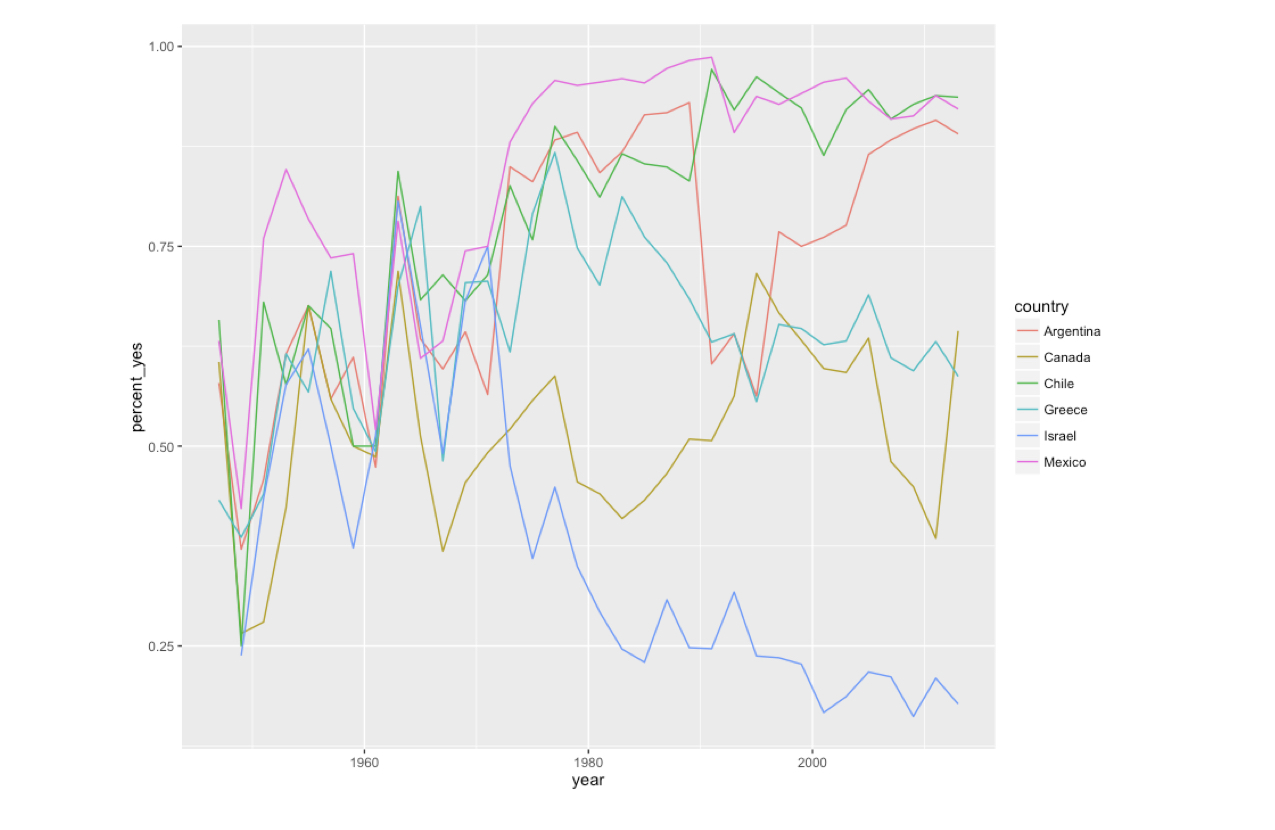
여러 국가 그래프화
ggplot(many_countries, aes(year, percent_yes)) +
  geom_line() +
  facet_wrap(~ country)
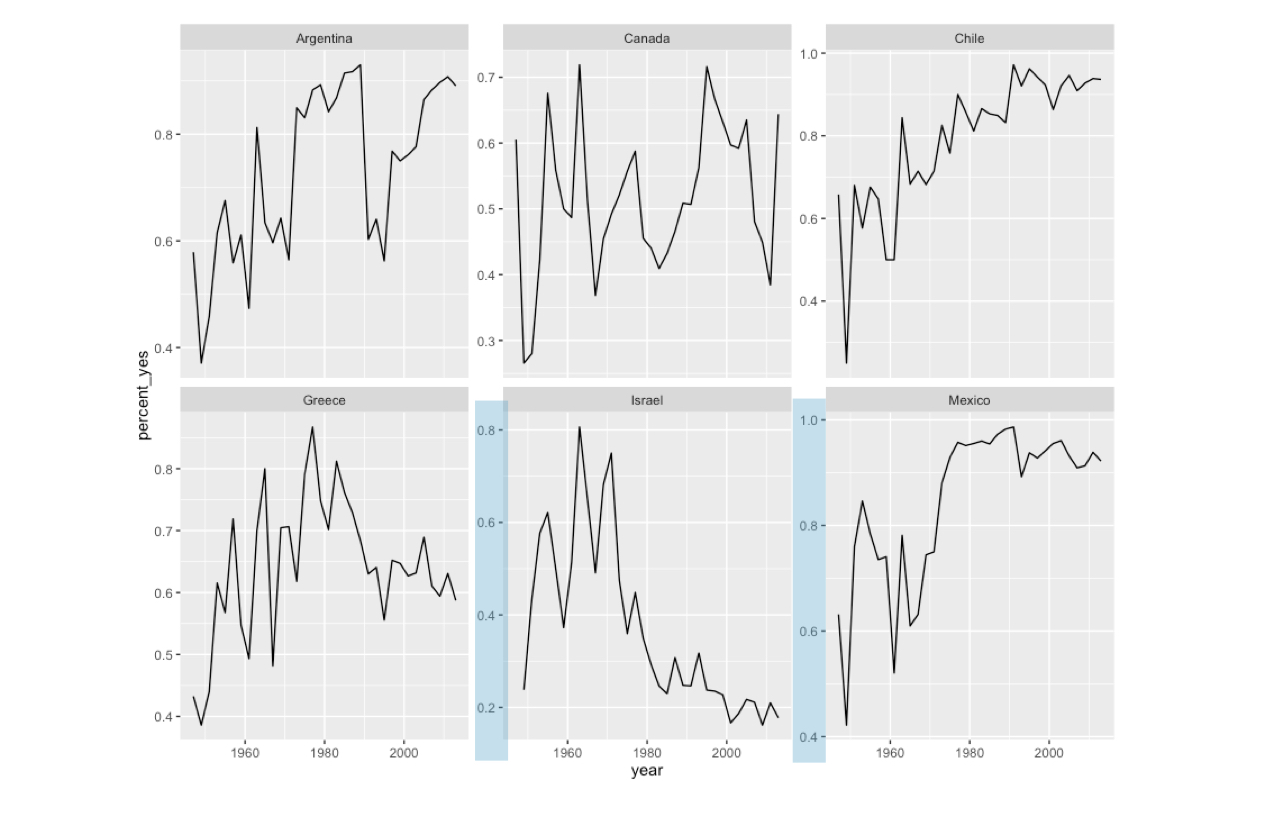
축을 분리해 그리기
ggplot(many_countries, aes(year, percent_yes)) +
  geom_line() +
  facet_wrap(~ country, scales = "free_y")
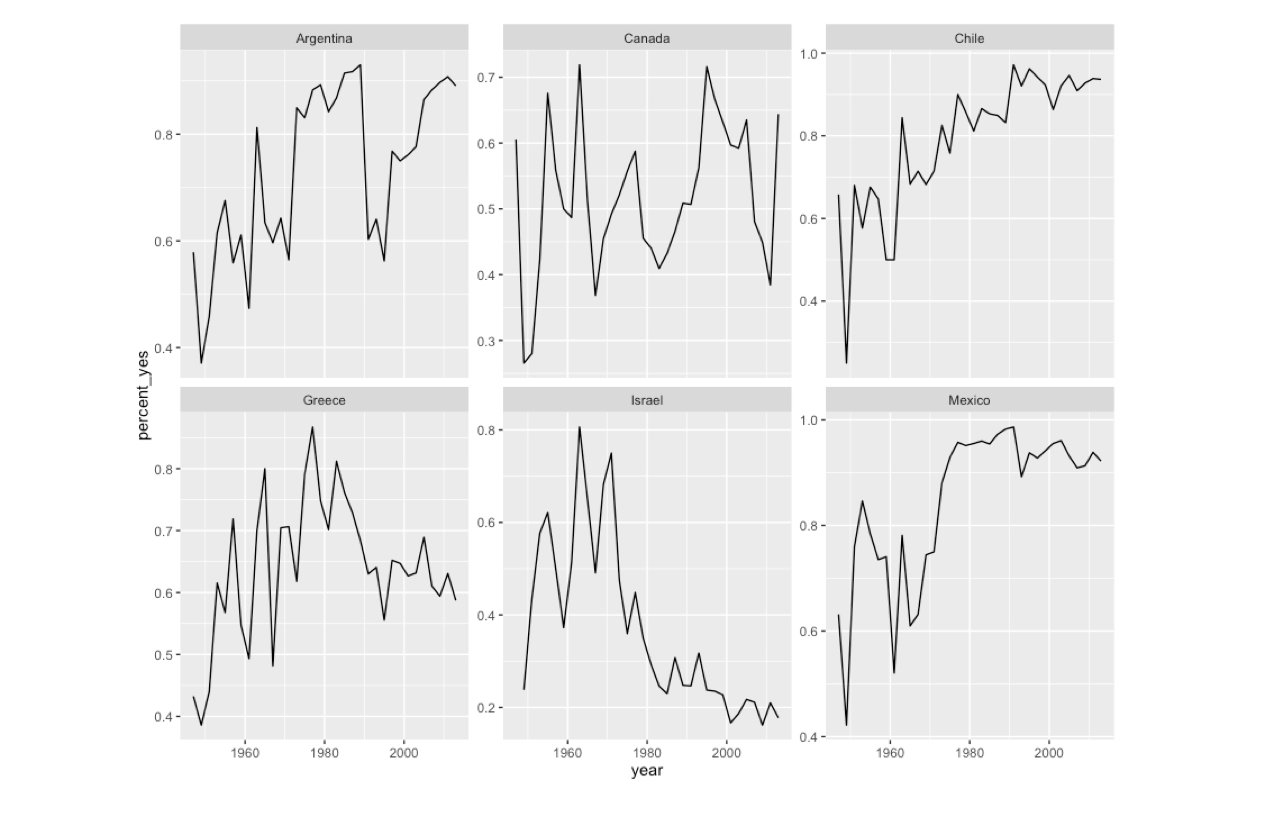
축을 분리해 그리기
ggplot(many_countries, aes(year, percent_yes)) +
  geom_line() +
  facet_wrap(~ country, scales = "free_y")
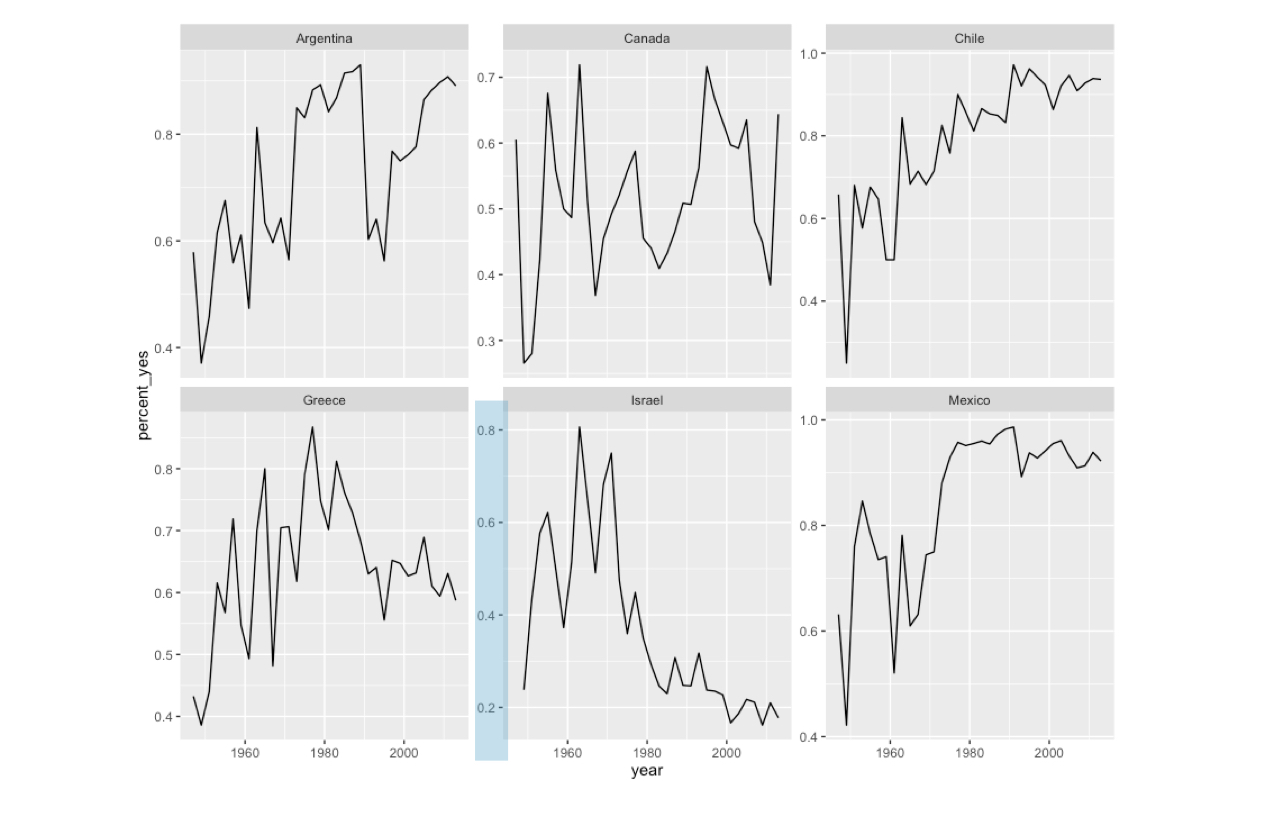
축을 분리해 그리기
ggplot(many_countries, aes(year, percent_yes)) +
  geom_line() +
  facet_wrap(~ country, scales = "free_y")