부트스트랩 시각화

Python으로 데이터 시각화 개선하기

Nick Strayer

Instructor

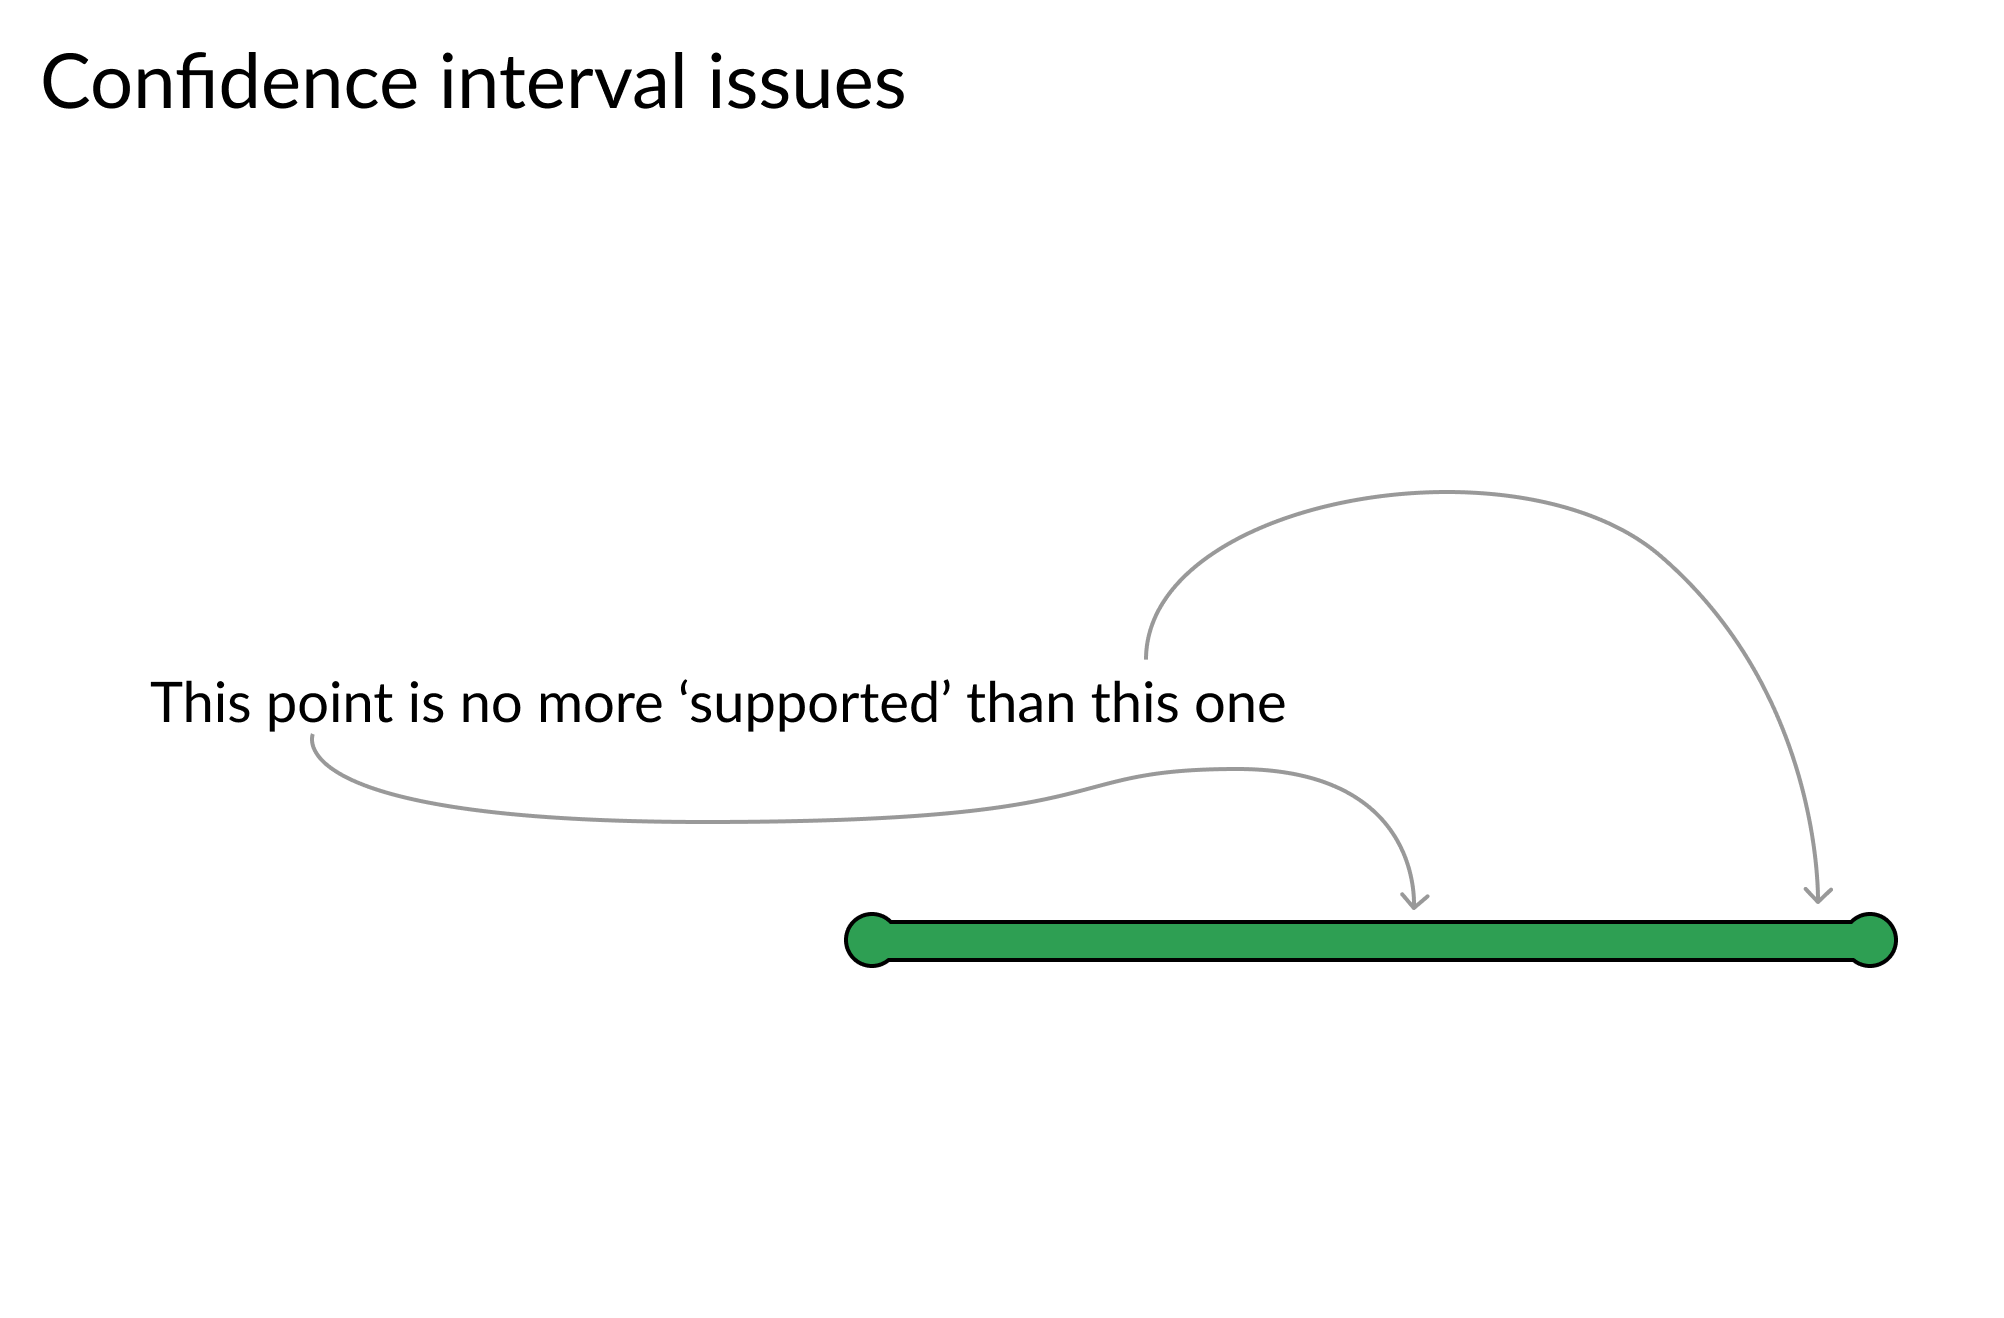
하한과 상한을 화살표로 표시한 단순 신뢰대

Python으로 데이터 시각화 개선하기

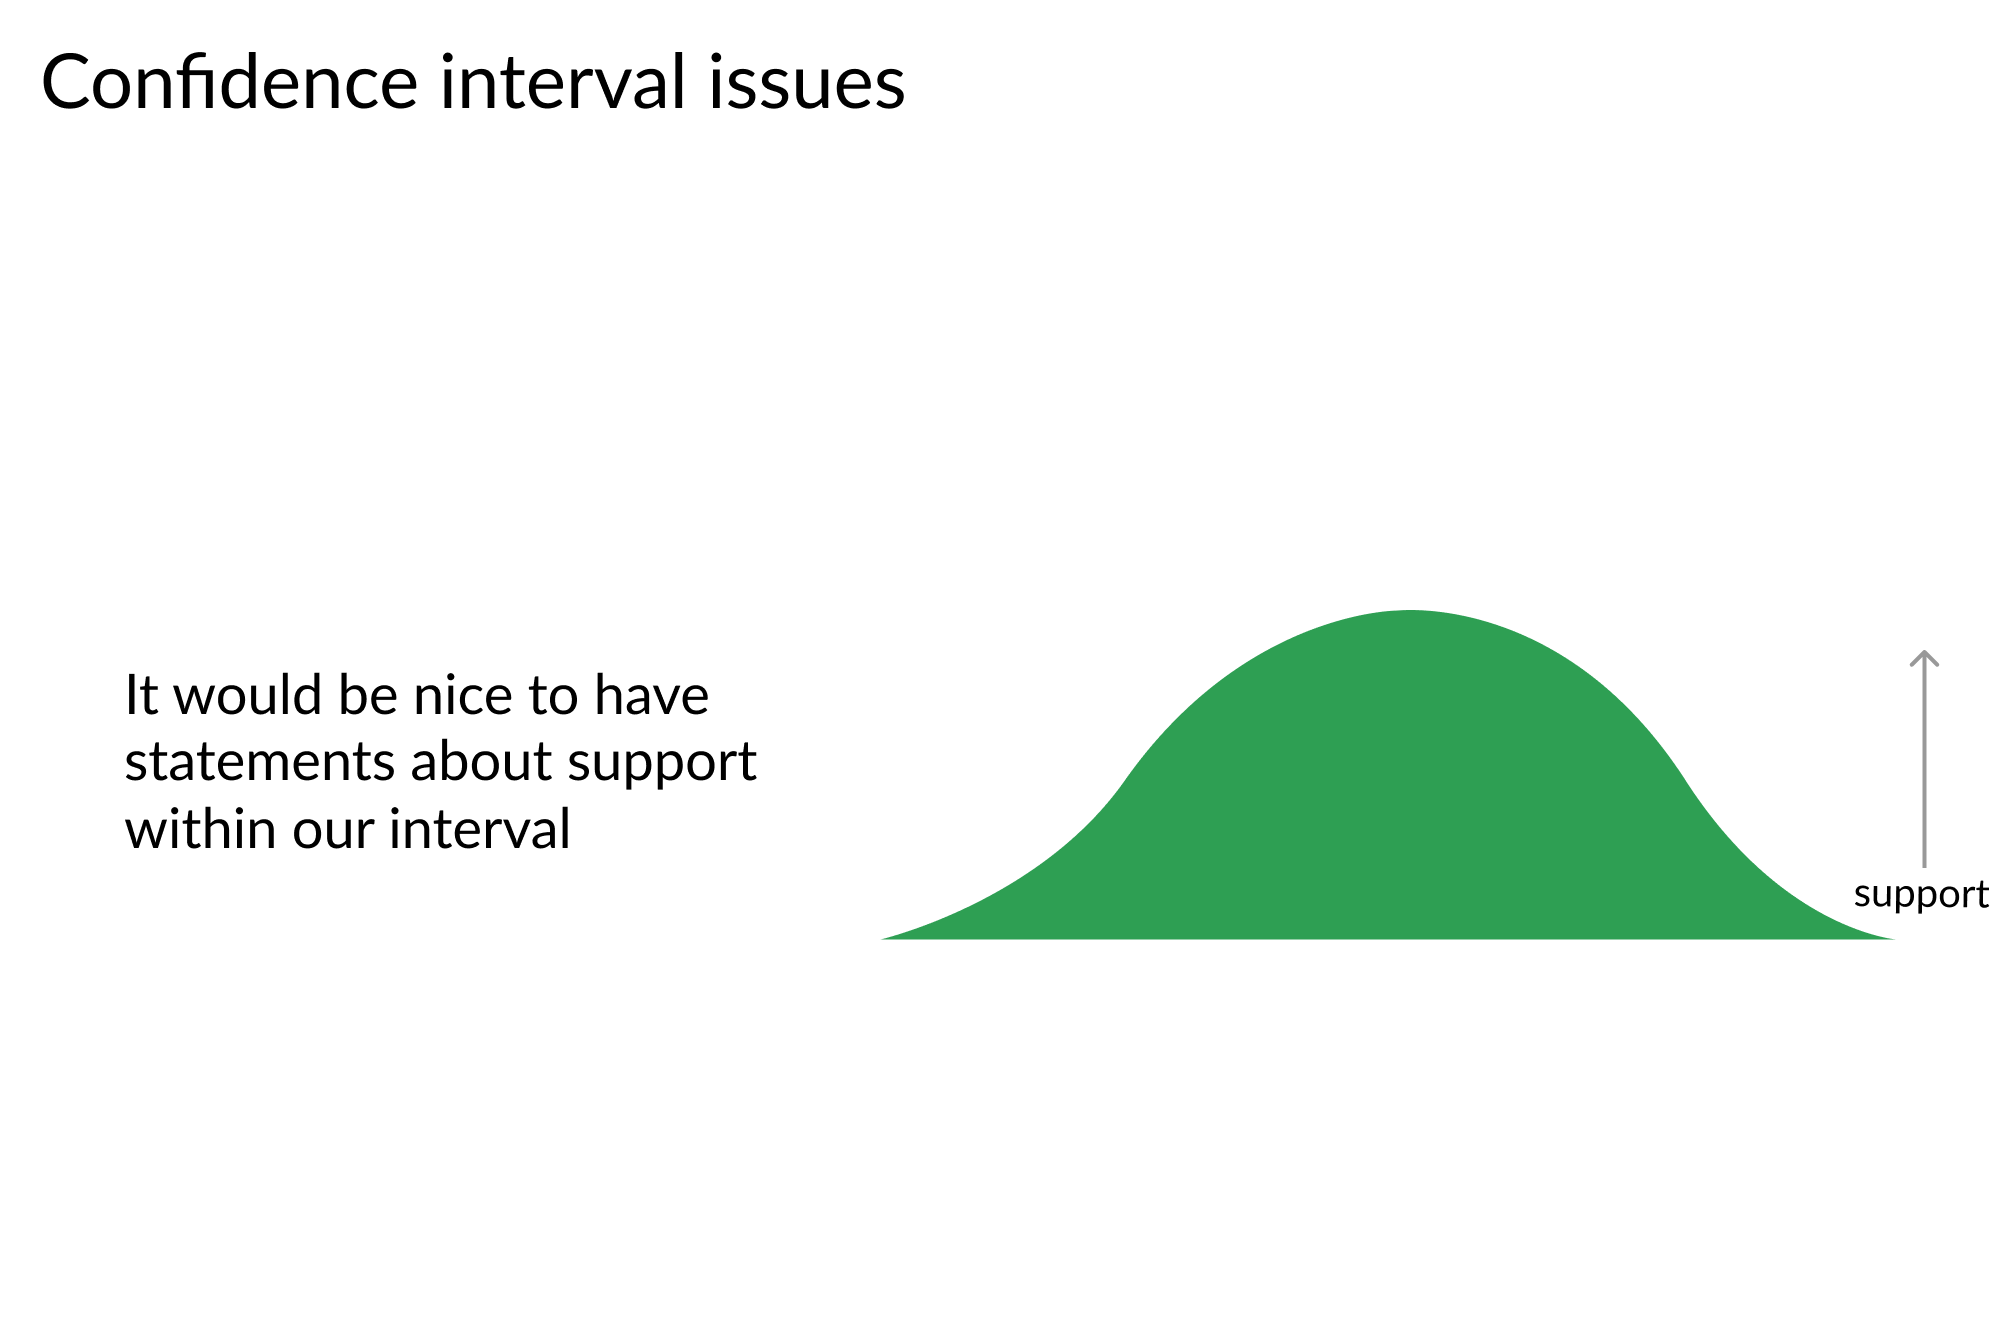
종 모양 곡선

Python으로 데이터 시각화 개선하기

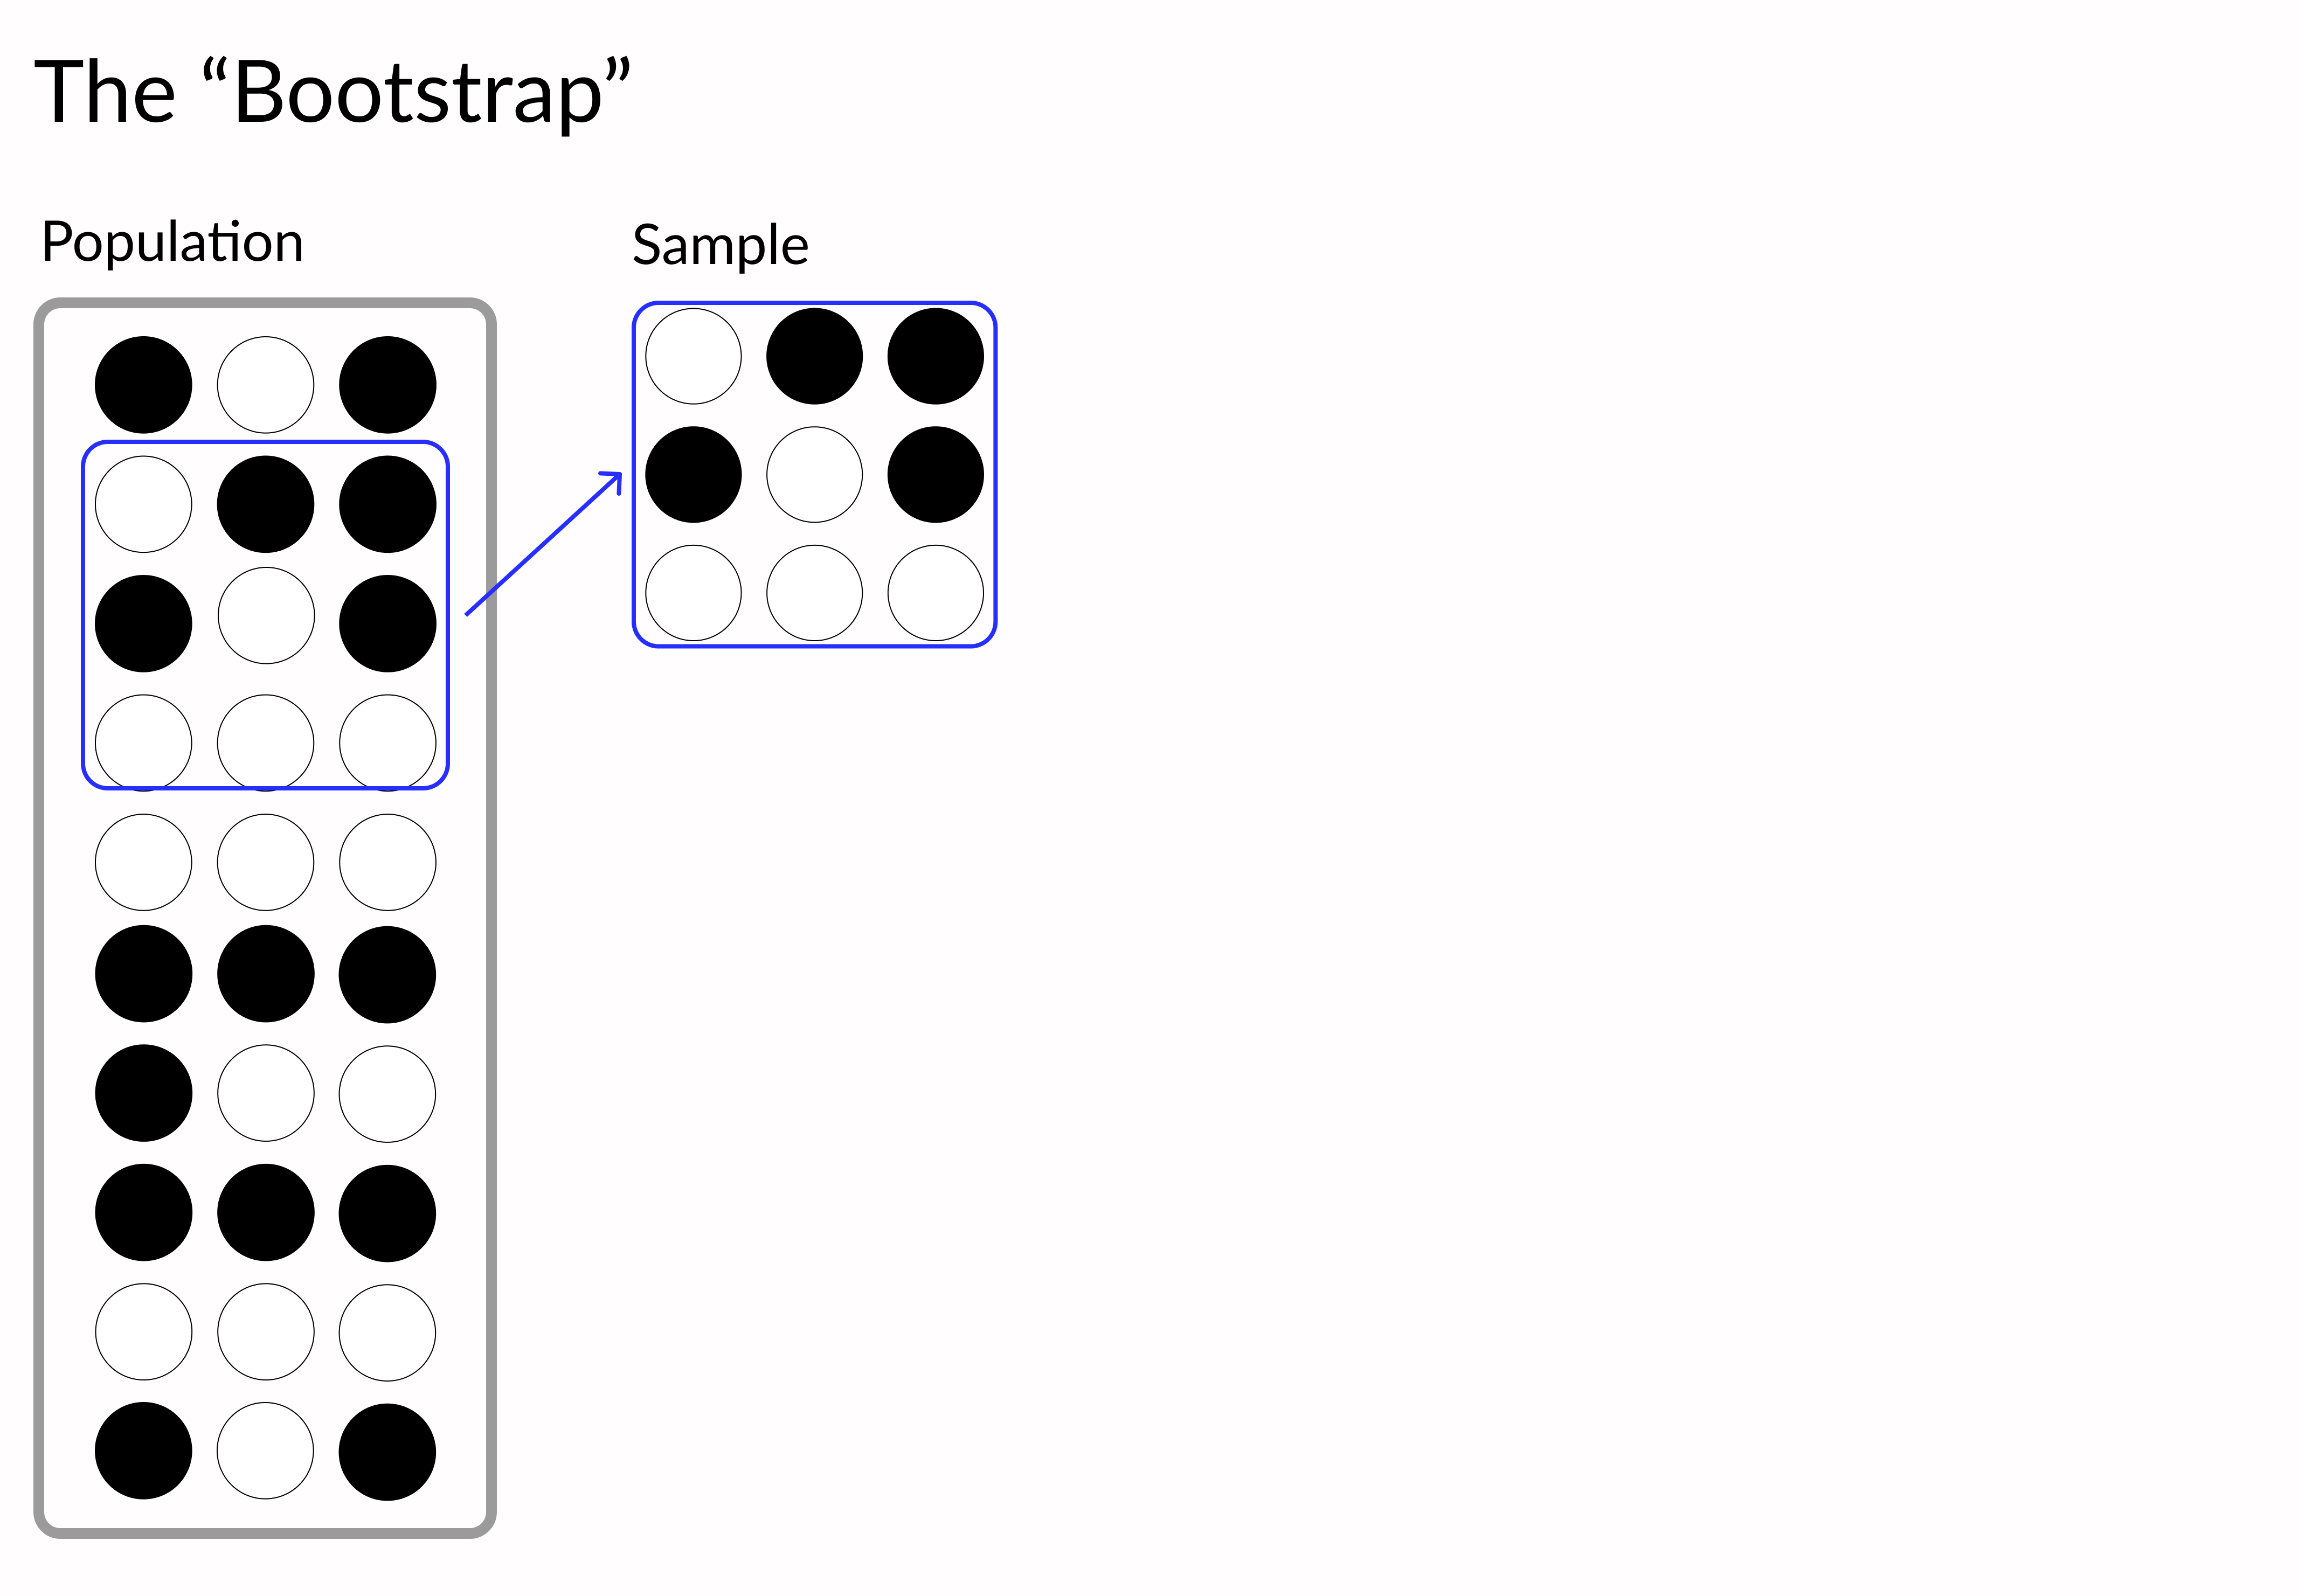
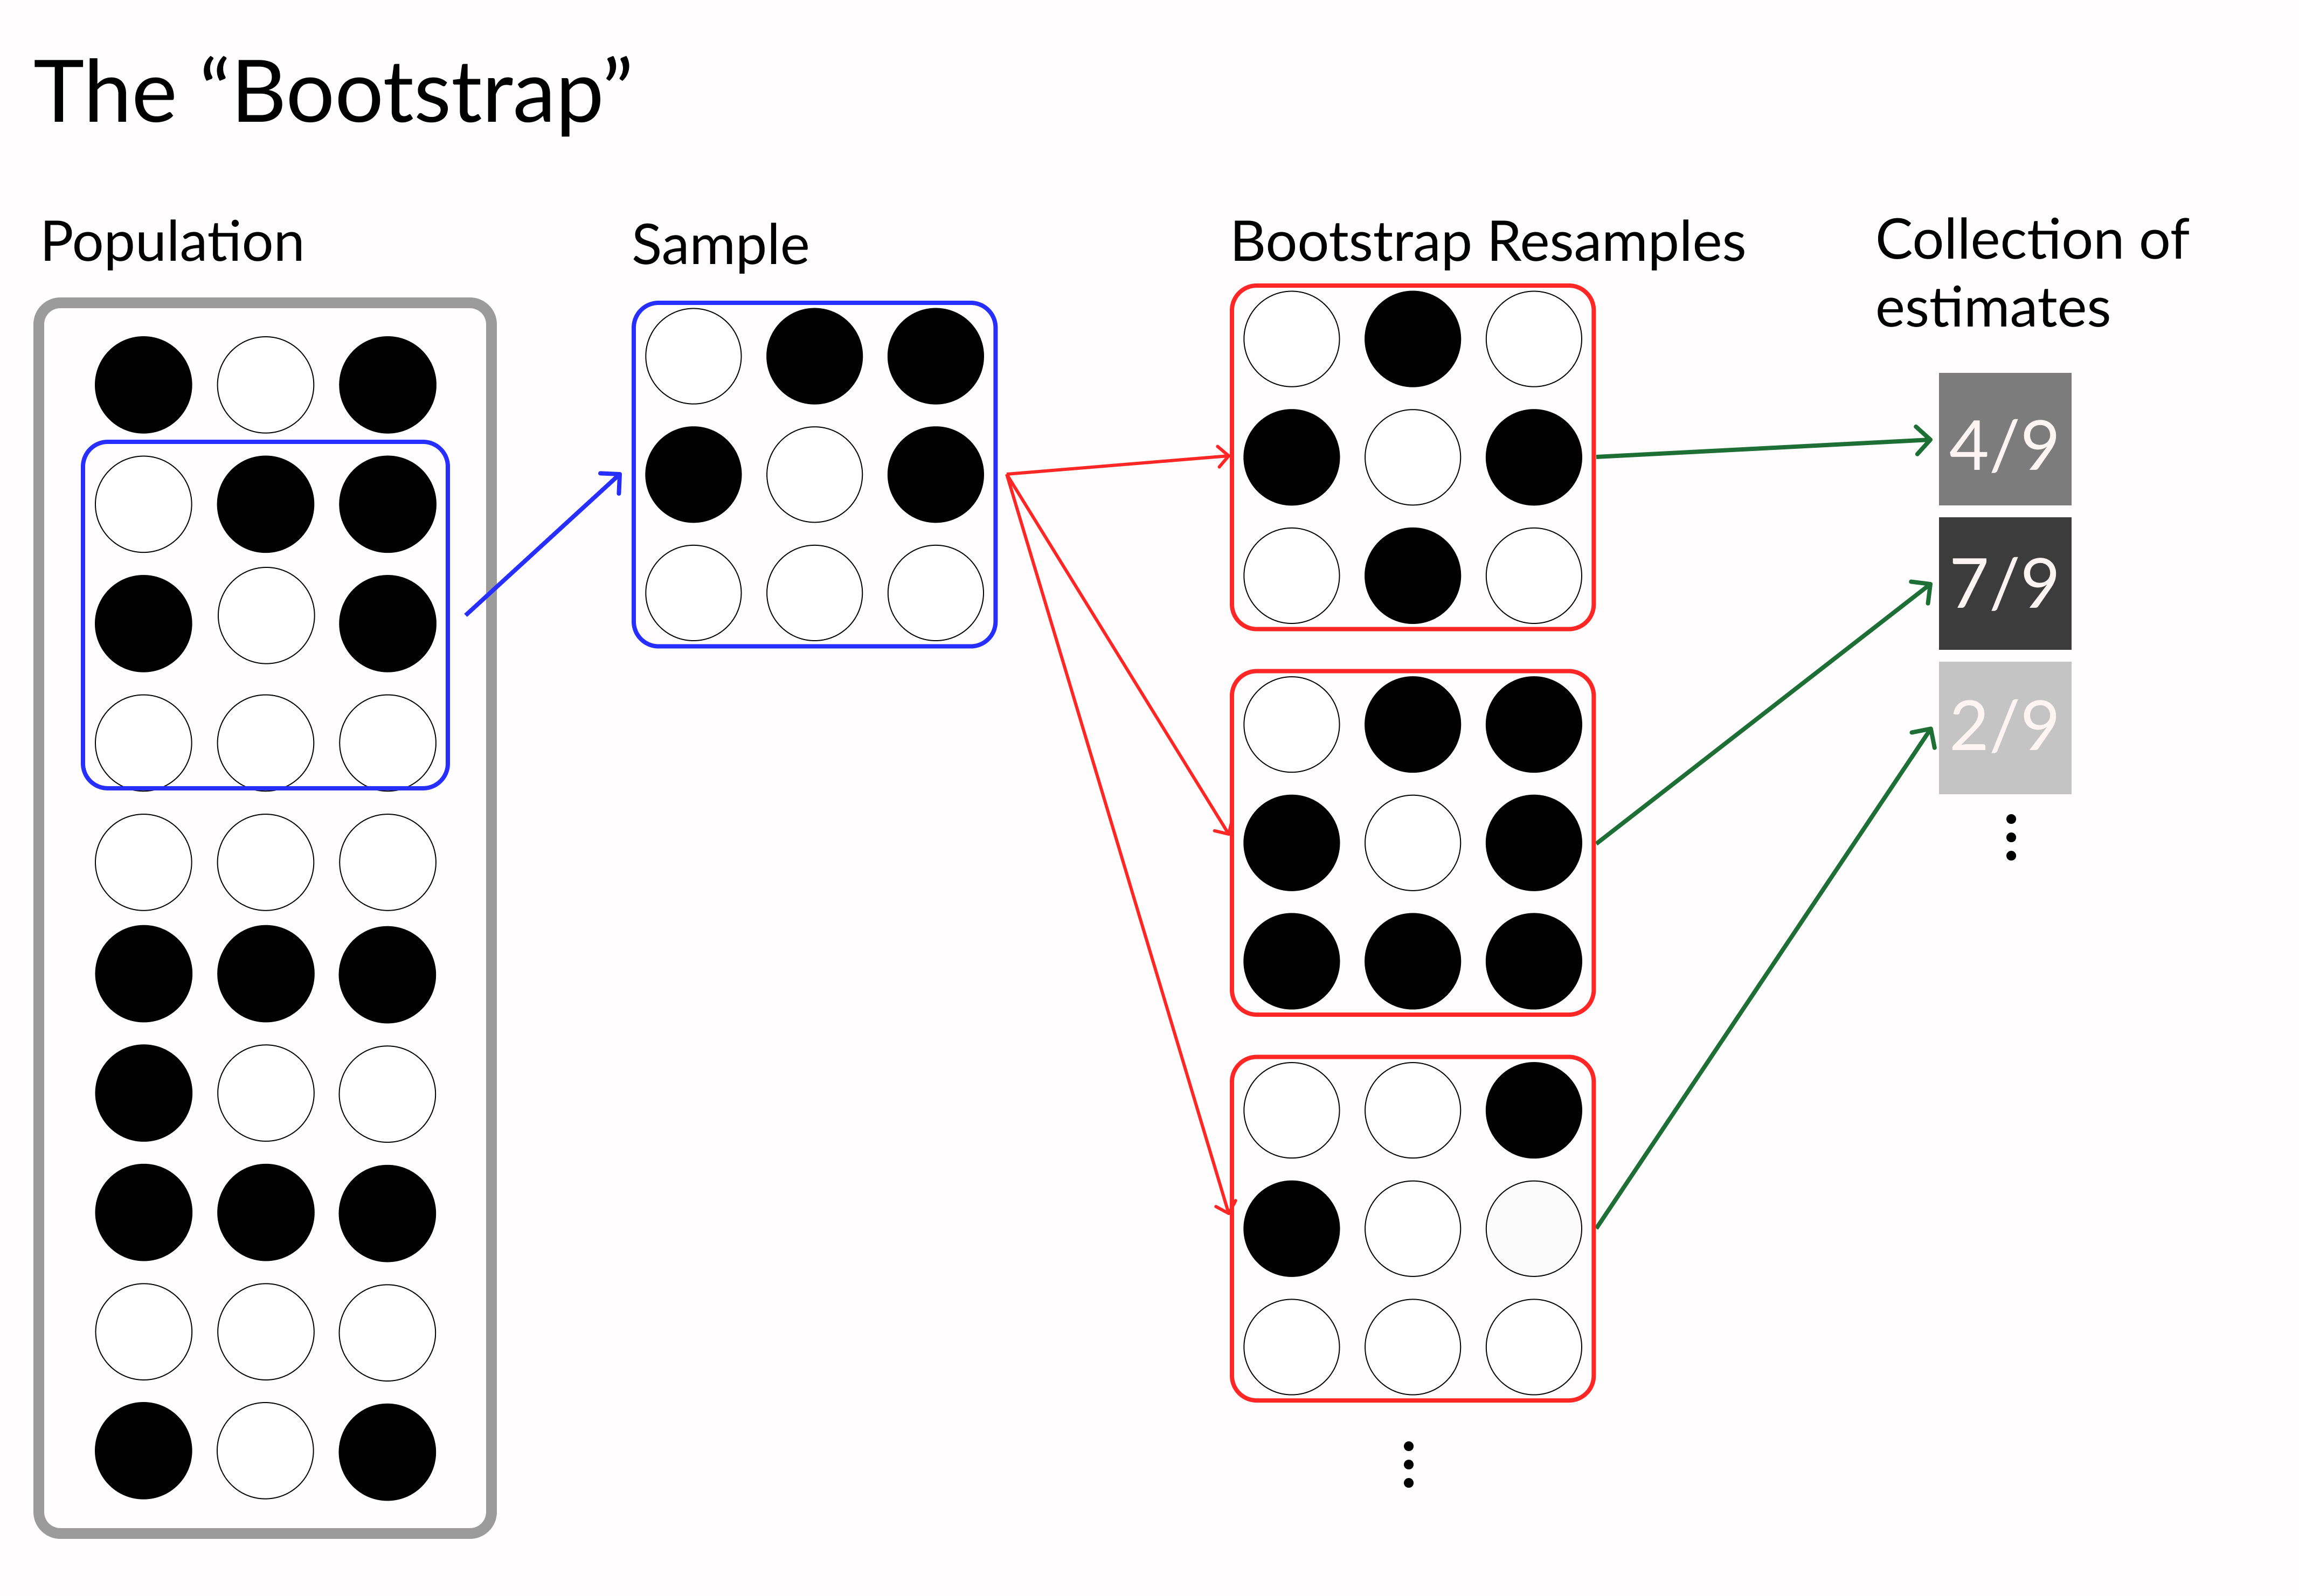
검은색과 흰색 점으로 이루어진 큰 모집단에서 더 작은 표본을 추출

Python으로 데이터 시각화 개선하기

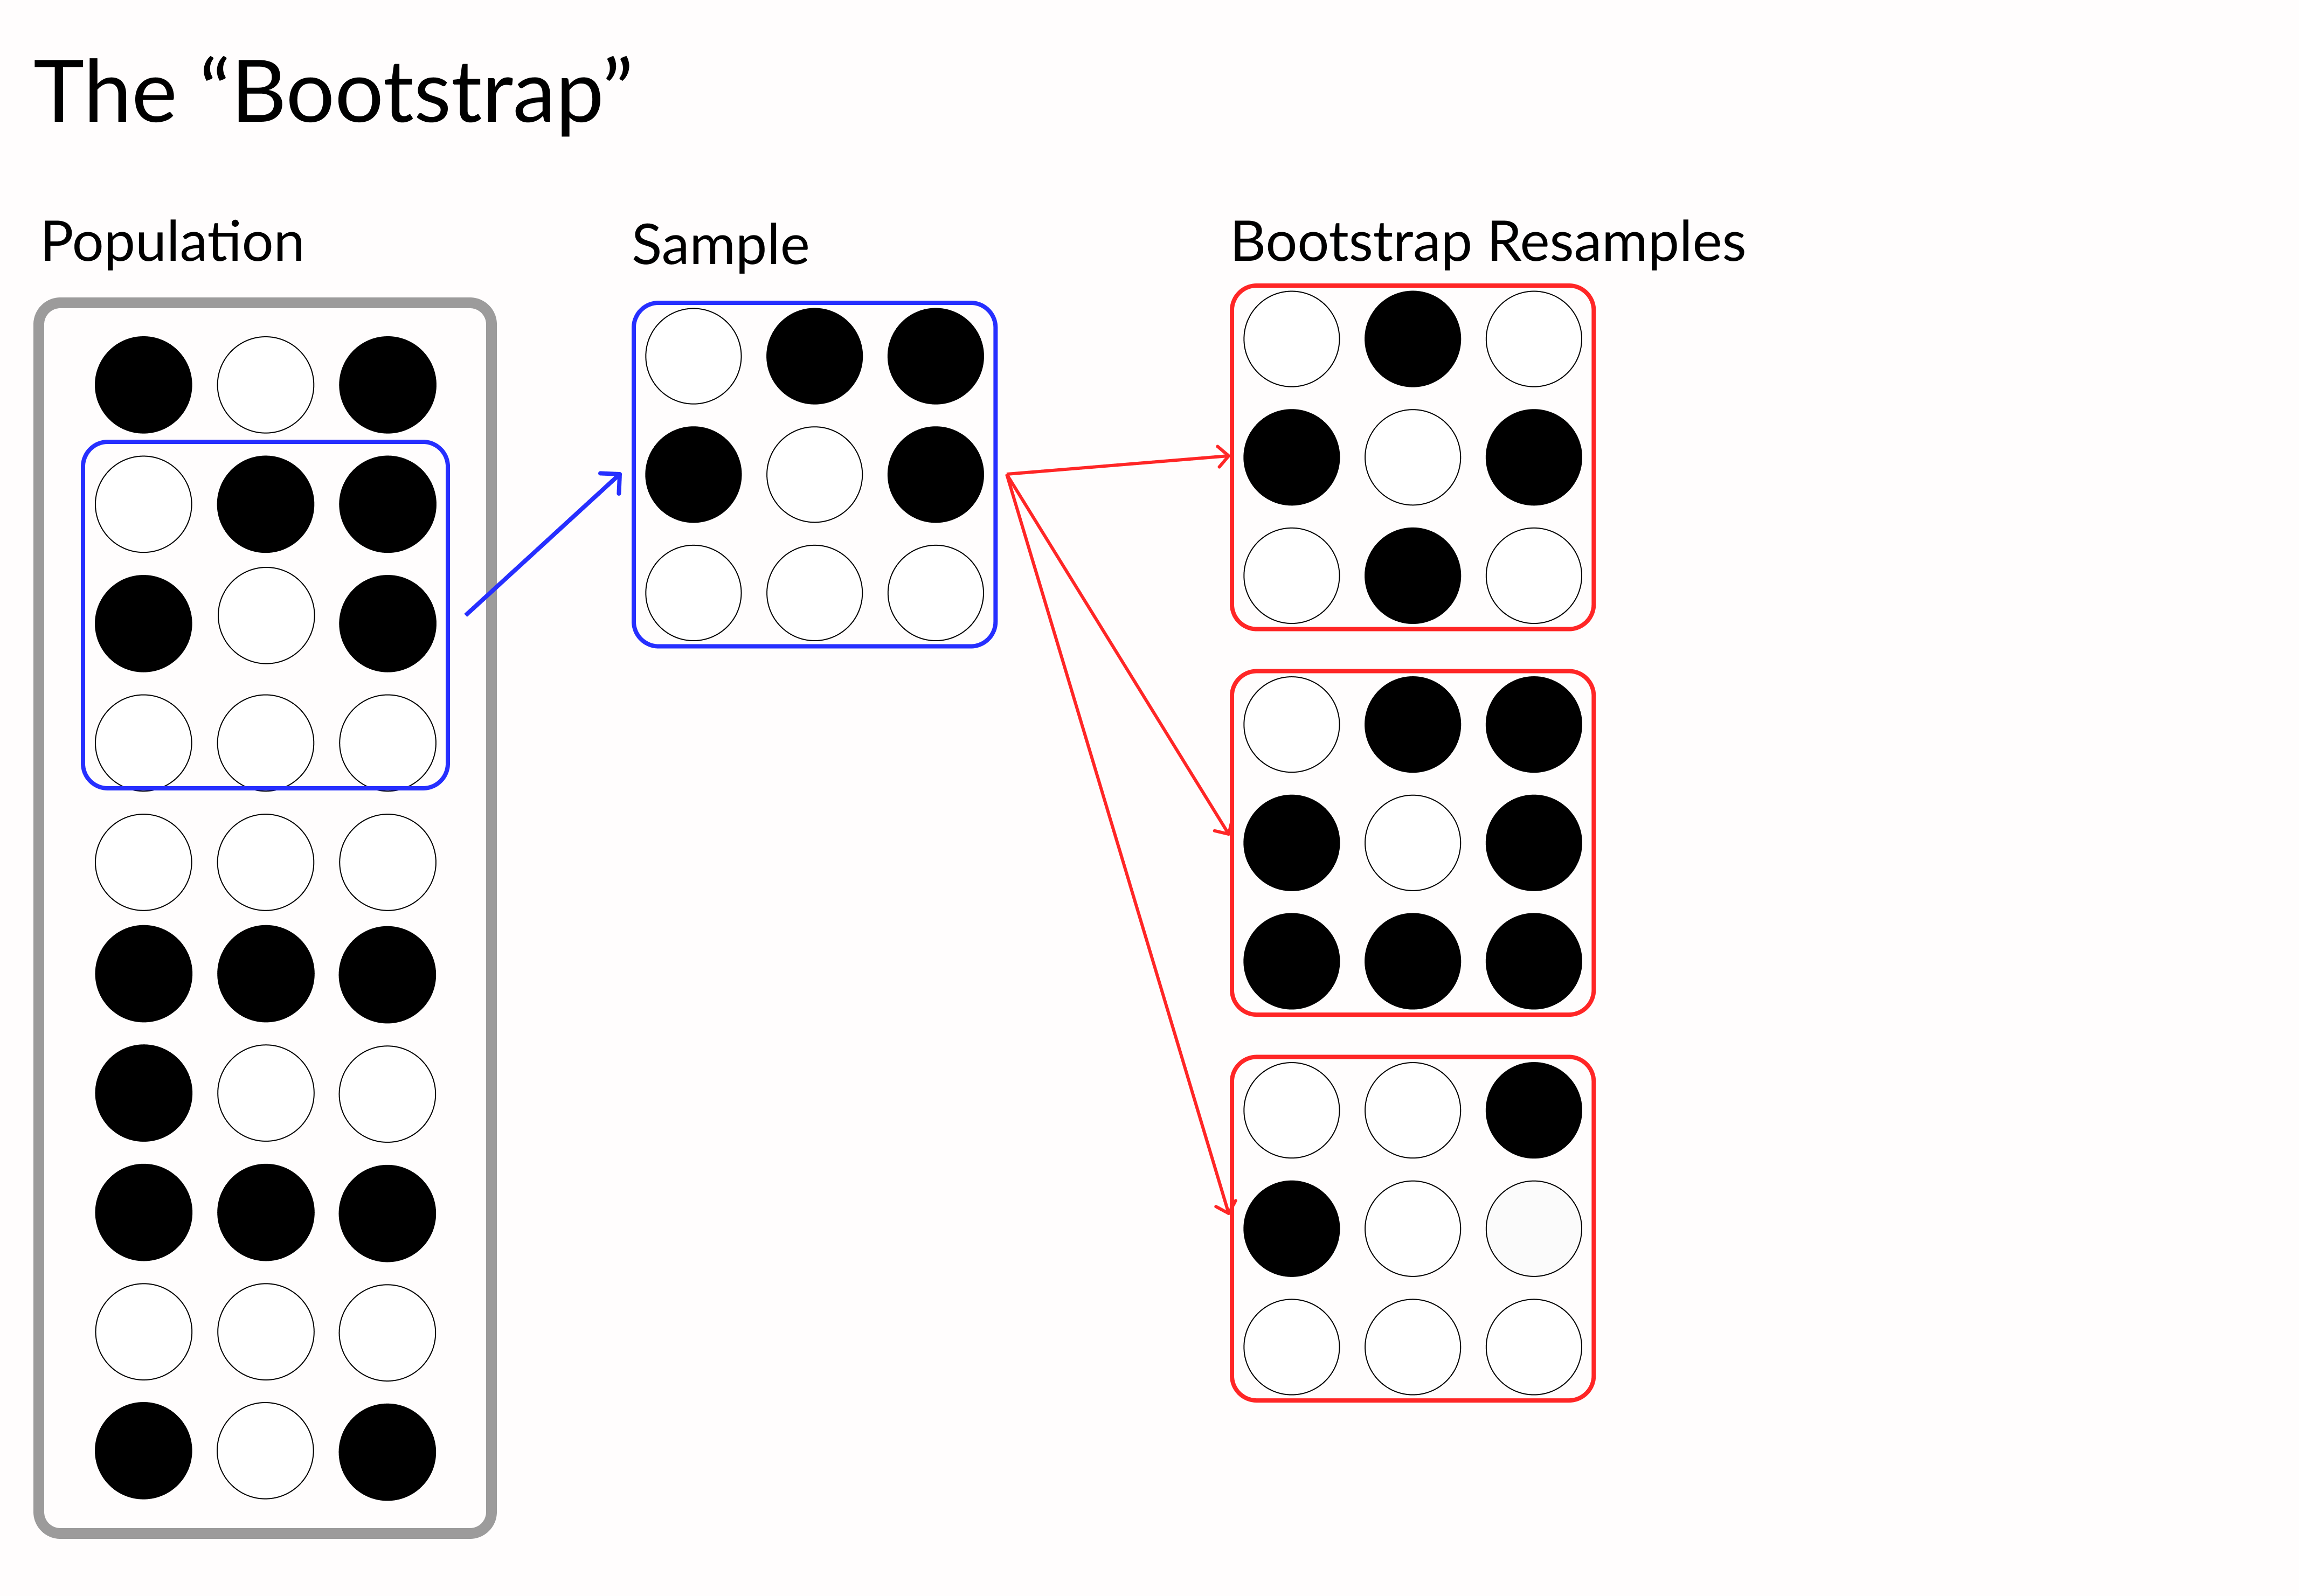
작은 흑백 점 표본을 여러 번 재표본추출하여 동일 크기의 데이터셋 생성

Python으로 데이터 시각화 개선하기

여러 흑백 점 모음이 흑백 비율에 따른 추정치 배열을 가리킴

Python으로 데이터 시각화 개선하기
denver_may = pollution.query("city == 'Denver' & month == 8")

# Perform bootstrapped mean on a vector
def bootstrap(data, n_boots): 
    return [np.mean(np.random.choice(data,len(data))) 
            for _ in range(n_boots) ]

# Generate 1,000 bootstrap samples
boot_means = bootstrap(denver_may.NO2, 1000)


# Get lower and upper 95% interval bounds lower, upper = np.percentile(boot_means, [2.5, 97.5]) # Shaded background of interval plt.axvspan(lower, upper, color='grey', alpha=0.2)
# Plot histogram of samples sns.histplot(boot_means, bins = 100)
Python으로 데이터 시각화 개선하기

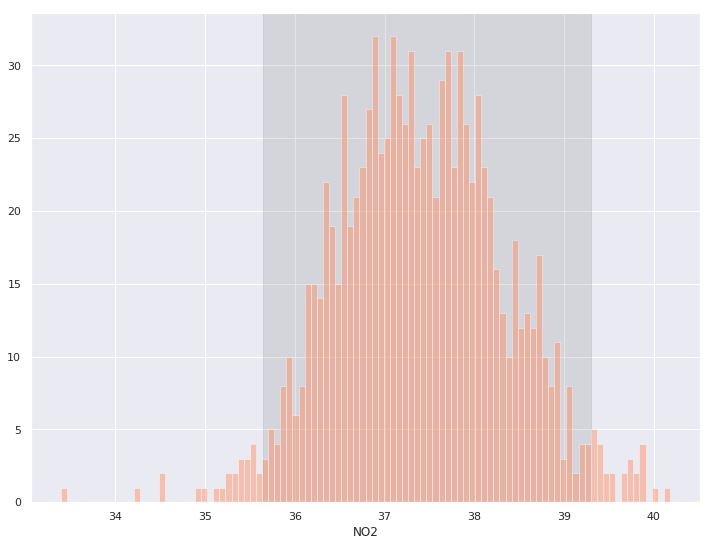
x축의 옅은 회색 구간을 포함한 세밀한 히스토그램

Python으로 데이터 시각화 개선하기
# 부트스트랩 데이터프레임 생성
denver_may_boot = pd.concat([
    denver_may.sample(n=len(denver_may), replace=True).assign(sample=i) 
    for i in range(100)])

# 각 표본에 대해 회귀선 그림
sns.lmplot('CO', 'O3', data=denver_may_boot, scatter=False,

# 각 재표본의 데이터로 회귀선 그림 hue='sample',
# 선을 주황색, 투명하게 설정 line_kws = {'color': 'coral', 'alpha': 0.2},
# 신뢰구간 표시 안 함 ci=None, legend = False)
Python으로 데이터 시각화 개선하기

비슷한 내리막 기울기의 선들이 여러 개

Python으로 데이터 시각화 개선하기
aug_pol = pollution.query("month == 8")

# 부트스트랩 표본 보관용 DataFrame
city_boots = pd.DataFrame()

for city in ['Denver', 'Long Beach', 'Houston', 'Indianapolis']:
    # 해당 도시의 NO2 필터링
    city_NO2 = aug_pol[aug_pol.city == city].NO2
    # 도시별 NO2를 100회 부트스트랩하여 DataFrame 생성
    cur_boot = pd.DataFrame({ 'NO2_avg': bootstrap(city_NO2, 100), 
                              'city': city })
    # 다른 도시 부트스트랩과 결합
    city_boots = pd.concat([city_boots,cur_boot])

# 벌무리(besswarm) 플롯으로 부트스트랩 시각화
sns.swarmplot(y="city", x="NO2_avg", data=city_boots, 

# 모든 색상을 동일하게 설정 color='coral')
Python으로 데이터 시각화 개선하기

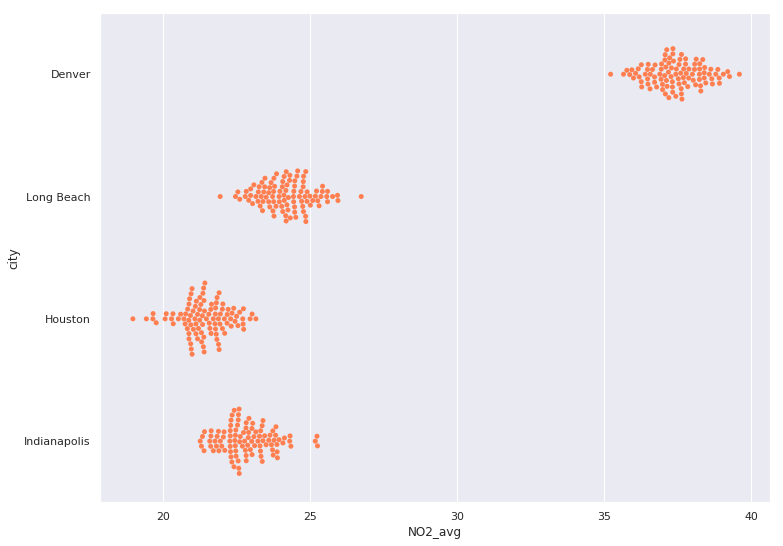
네 개의 벌무리 플롯에서 한 집단이 x축에서 다른 집단보다 오른쪽에 분포

Python으로 데이터 시각화 개선하기

재표본추출을 시작해 봅시다

Python으로 데이터 시각화 개선하기

Preparing Video For Download...