모형 적합도 평가
R에서 tidymodels로 모델링하기

David Svancer
Data Scientist
이진 분류
두 수준의 결과 변수
- 양성 클래스
- 예측하고자 하는 사건
purchased변수에서 "yes"
음성 클래스
- "no"
tidymodels에서는 결과 변수가 팩터여야 함- 첫 수준이 양성 클래스
levels()로 순서 확인
leads_df
# A tibble: 1,328 x 7
  purchased total_visits  ...   us_location
   <fct>        <dbl>     ...     <fct>
 1 yes            7       ...     west
 2 no             8       ...     west
 3 no             5       ...     southeast
# ... with 1,325 more rows
levels(leads_df[['purchased']])
[1] "yes" "no"
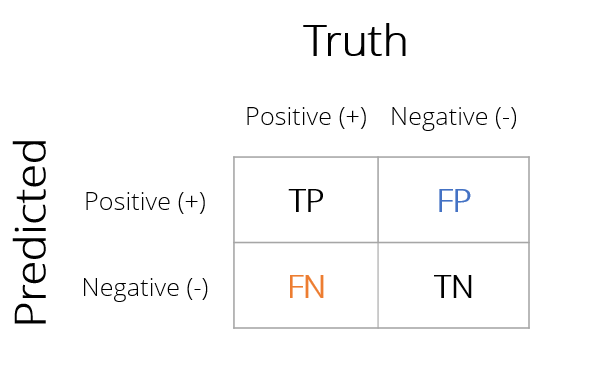
혼동 행렬
실제값과 예측값의 모든 조합을 집계한 행렬
정답 예측
- 진양성(TP)
- 진음성(TN)
분류 오류
- 거짓 양성(FP)
- 거짓 음성(FN)
yardstick 분류 지표
yardstick으로 혼동 행렬과 기타 적합도 지표 만들기
- 다음을 포함한 모형 결과 티블 필요:
- 실제 결과 값
purchased
- 예측 범주
.pred_class
- 각 범주의 추정 확률
.pred_yes.pred_no
- 실제 결과 값
leads_results
# A tibble: 332 x 4
   purchased .pred_class .pred_yes .pred_no
   <fct>     <fct>           <dbl>    <dbl>
 1 no        no             0.134     0.866
 2 yes       yes            0.729     0.271
 3 no        no             0.133     0.867
 4 no        no             0.0916    0.908
 5 yes       yes            0.598     0.402
 6 no        no             0.128     0.872
 7 yes       no             0.112     0.888
 8 no        no             0.169     0.831
 9 no        no             0.158     0.842
10 yes       yes            0.520     0.480
# ... with 322 more rows
yardstick으로 혼동 행렬
conf_mat() 함수
- 모형 결과의 티블
truth- 실제 정답 열estimate- 예측 결과 열
leads_df에 대한 로지스틱 회귀
- 고객 332명 중 252명 정확(76%)
- 거짓 음성 46건
- 거짓 양성 34건
conf_mat(leads_results,truth = purchased,estimate = .pred_class)
Truth
Prediction yes no
yes 74 34
no 46 178
분류 정확도
accuracy() 함수
conf_mat()와 동일한 인수 사용- 분류 정확도 계산
$$\frac{TP + TN}{TP + TN + FP + FN}$$
yardstick함수는 항상 티블 반환.metric- 지표 유형.estimate- 계산값
accuracy(leads_results,
truth = purchased,
estimate = .pred_class)
# A tibble: 1 x 3
.metric .estimator .estimate
<chr> <chr> <dbl>
1 accuracy binary 0.759
민감도
많은 경우 정확도는 최선의 지표가 아님
leads_df데이터- 모두 'no'로 예측해도 정확도 64%
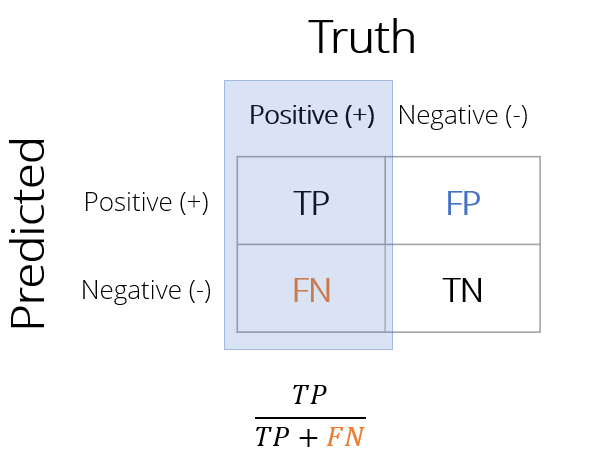
민감도(Sensitivity)
모든 양성 중 올바르게 분류된 비율
- 실제로 구매한 고객 중, 모형이 맞힌 비율은?
- 거짓 음성이 적을수록 민감도 상승
민감도 계산
sens() 함수
conf_mat(),accuracy()와 동일한 인수 사용.estimate열에 민감도 반환
sens(leads_results,
truth = purchased,
estimate = .pred_class)
# A tibble: 1 x 3
.metric .estimator .estimate
<chr> <chr> <dbl>
1 sens binary 0.617
특이도
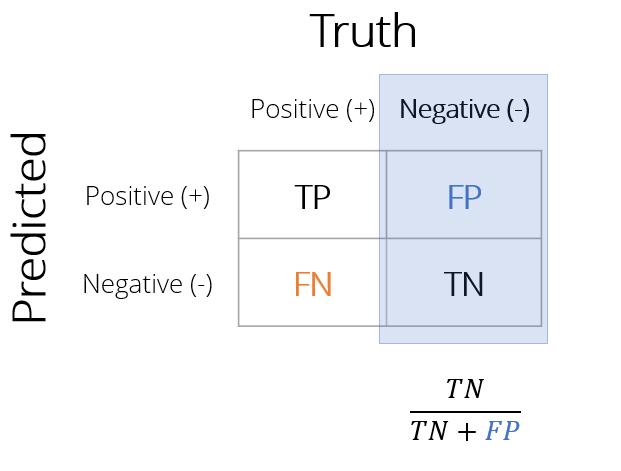
특이도(Specificity): 모든 음성 중 올바르게 분류된 비율
- 구매하지 않은 고객 중, 모형이 맞힌 비율은?
- 거짓 양성이 적을수록 특이도 상승
1 - 특이도
- 거짓 양성률(FPR)이라고도 함
- 진음성 중 거짓 양성의 비율
특이도 계산
spec() 함수
sens()와 동일한 인수 사용.estimate열에 특이도 반환
spec(leads_results,
truth = purchased,
estimate = .pred_class)
# A tibble: 1 x 3
.metric .estimator .estimate
<chr> <chr> <dbl>
1 spec binary 0.840
지표 세트 만들기
사용자 정의 지표 세트
metric_set()함수- 선택한
yardstick지표로 사용자 정의 지표 함수 생성 metric_set()에 지표 함수명을 전달- 만든 함수를 사용해 지표 계산
- 선택한
custom_metrics <-
metric_set(accuracy, sens, spec)
custom_metrics(leads_results,
truth = purchased,
estimate = .pred_class)
# A tibble: 3 x 3
.metric .estimator .estimate
<chr> <chr> <dbl>
1 accuracy binary 0.759
2 sens binary 0.617
3 spec binary 0.840
다양한 지표
이진 분류 지표
다양한 이진 분류 지표
accuracy(),kap(),sens(),spec(),ppv(),npv(),mcc(),j_index(),bal_accuracy(),detection_prevalence(),precision(),recall(),f_meas()
모든 지표 계산:
conf_mat()결과를summary()에 전달
conf_mat(leads_results,

         truth = purchased,

estimate = .pred_class) %>%
summary()
# A tibble: 13 x 3
   .metric              .estimator .estimate
   <chr>                <chr>          <dbl>
 1 accuracy             binary         0.759
 2 kap                  binary         0.466
 3 sens                 binary         0.617
 4 spec                 binary         0.840
 5 ppv                  binary         0.685
 6 npv                  binary         0.795
 7 mcc                  binary         0.468
 8 j_index              binary         0.456
 9 bal_accuracy         binary         0.728
10 detection_prevalence binary         0.325
11 precision            binary         0.685
12 recall               binary         0.617
13 f_meas               binary         0.649
Ayo berlatih!
R에서 tidymodels로 모델링하기

