리샘플링: 몬테카를로 시뮬레이션의 특수한 형태

Python으로 배우는 Monte Carlo 시뮬레이션

Izzy Weber

Curriculum Manager, DataCamp

리샘플링: 몬테카를로 시뮬레이션의 특수한 형태


몬테카를로 시뮬레이션

  • 확률분포에서 표본 추출
  • 분포는 알려졌거나 가정됨
  • 과거 데이터나 전문지식으로 적절한 분포 선택


리샘플링

  • 기존 데이터에서 무작위 추출
  • 기존 데이터가 암묵적 확률분포
  • 데이터가 대표성을 가진다고 가정
Python으로 배우는 Monte Carlo 시뮬레이션

리샘플링 방법

  1. 비복원 추출
    • 무작위 표본 추출에 사용
  2. 복원 추출(부트스트래핑)
    • 거의 모든 통계량의 표집분포 추정에 사용
  3. 퍼뮤테이션
    • 두 그룹 비교에 자주 사용
Python으로 배우는 Monte Carlo 시뮬레이션

비복원 추출

뉴잉글랜드의 6개 주 중 서로 다른 두 주를 무작위로 추출

import random
def two_random_ne_states():

ne_states=["Maine", "Vermont", "New Hampshire", "Massachusetts", "Connecticut", "Rhode Island"]
return(random.sample(ne_states, 2))


two_random_ne_states()
['Massachusetts', 'Connecticut']
['New Hampshire', 'Maine']
Python으로 배우는 Monte Carlo 시뮬레이션

부트스트래핑

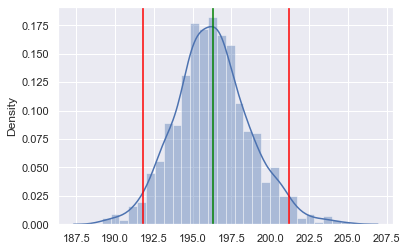
NBA 선수 평균 신장의 95% 신뢰구간 추정

import random
import numpy as np

nba_heights = [196, 191, 198, 216, 188, 185, 211, 201,
               188, 191, 201, 208, 191, 183, 196]
simu_heights = []

for i in range(1000): bootstrap_sample = random.choices(nba_heights, k=15) simu_heights.append(np.mean(bootstrap_sample))
upper = np.quantile(simu_heights, 0.975) lower = np.quantile(simu_heights, 0.025) print([np.mean(simu_heights), lower, upper])
[196.26666666666668, 191.8, 201.2]
Python으로 배우는 Monte Carlo 시뮬레이션

부트스트랩 결과 시각화

시각화 라이브러리:

  • seaborn
  • matplotlib
import seaborn as sns
import matplotlib.pyplot as plt

sns.displot(simu_heights)
plt.axvline(191.8, color="red")
plt.axvline(201.2, color="red")
plt.axvline(196.3, color="green")


시뮬레이션 신장 분포 플롯

Python으로 배우는 Monte Carlo 시뮬레이션

퍼뮤테이션

NBA 선수와 미국 남성의 평균 신장 차이의 95% 신뢰구간 추정

us_heights = [165, 185, 179, 187, 193, 180, 178, 179, 171, 176, 
              169, 160, 140, 199, 176, 185, 175, 196, 190, 176]
nba_heights = [196, 191, 198, 216, 188, 185, 211, 201, 188, 191, 201, 208, 191, 183, 196]

all_heights = us_heights + nba_heights
simu_diff = [] for i in range(1000): perm_sample = np.random.permutation(all_heights) perm_nba, perm_adult = perm_sample[0:15], perm_sample[15:35]
perm_diff = np.mean(perm_nba) - np.mean(perm_adult) simu_diff.append(perm_diff)
Python으로 배우는 Monte Carlo 시뮬레이션

퍼뮤테이션 결과

NBA와 미국 성인 남성 신장의 평균 차이:

np.mean(nba_heights) - np.mean(us_adult_height)
18.31666666666669

두 무작위 리스트 퍼뮤테이션의 95% 신뢰구간:

upper = np.quantile(simu_diff, 0.975)
lower = np.quantile(simu_diff, 0.025)
print([lower, upper])
[-10.033333333333331, 10.033333333333331]
Python으로 배우는 Monte Carlo 시뮬레이션

퍼뮤테이션 결과 시각화

sns.distplot(simu_diff)
plt.axvline(-10.03, color="red")
plt.axvline(10.03, color="red")
plt.axvline(18.32, color="green")
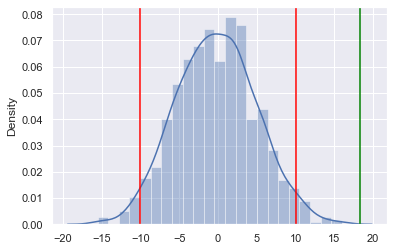
시뮬레이션 신장 분포 플롯

Python으로 배우는 Monte Carlo 시뮬레이션

연습해 봅시다!

Python으로 배우는 Monte Carlo 시뮬레이션

Preparing Video For Download...