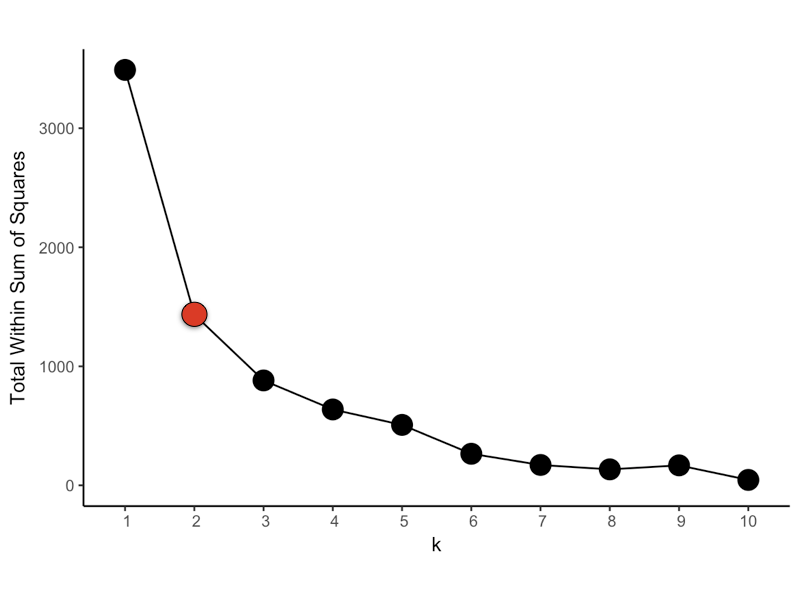
눈으로 K 값 평가하기

R로 배우는 군집 분석

Dmitriy (Dima) Gorenshteyn

Lead Data Scientist, Memorial Sloan Kettering Cancer Center

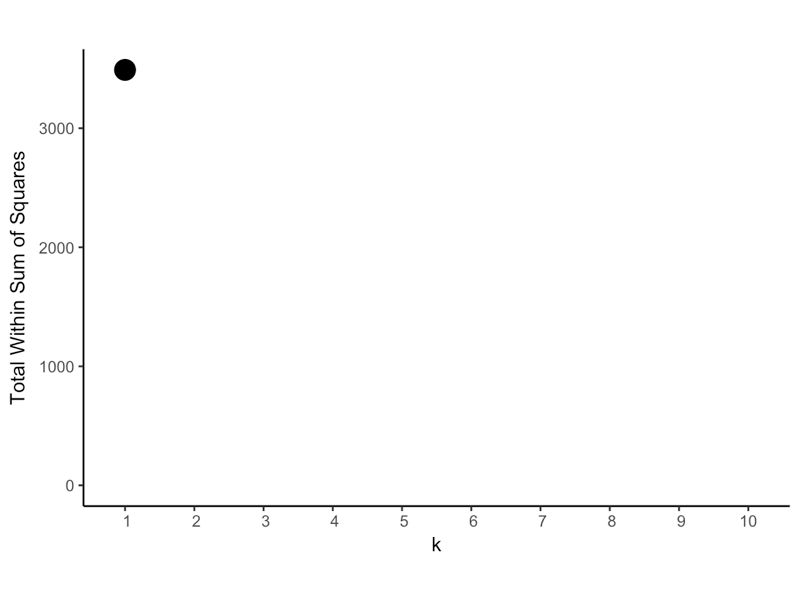
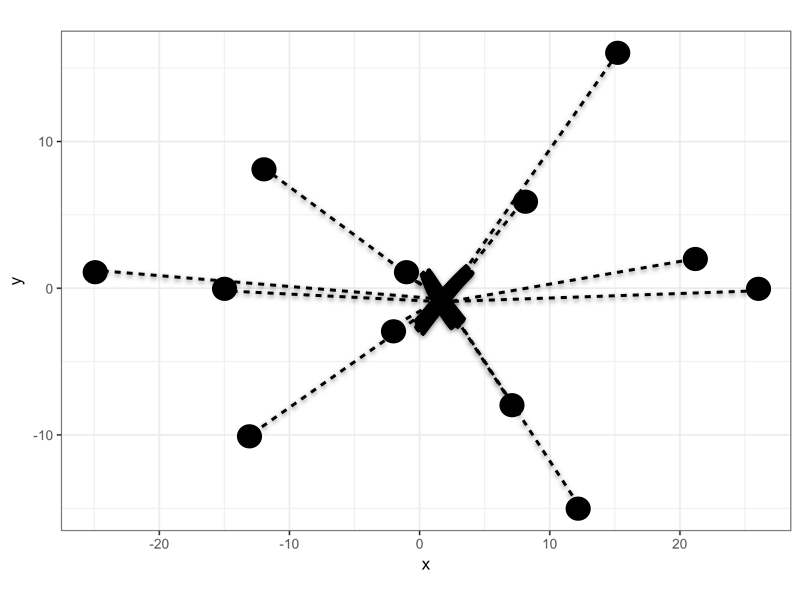
클러스터 내 총 제곱합: k = 1
R로 배우는 군집 분석

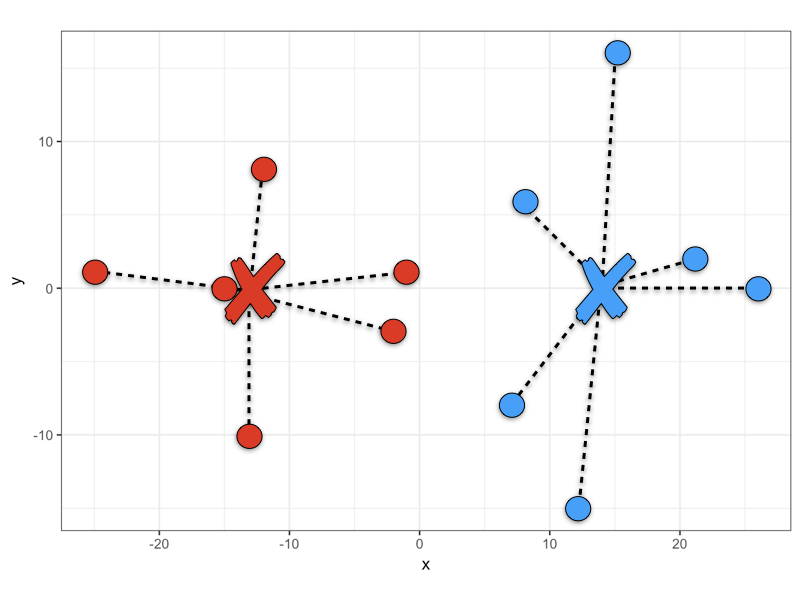
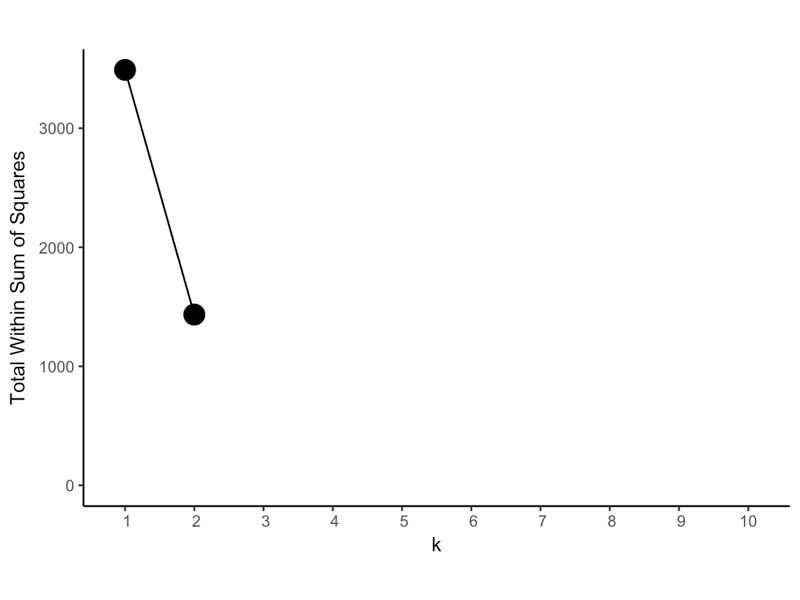
클러스터 내 총 제곱합: k = 2

R로 배우는 군집 분석

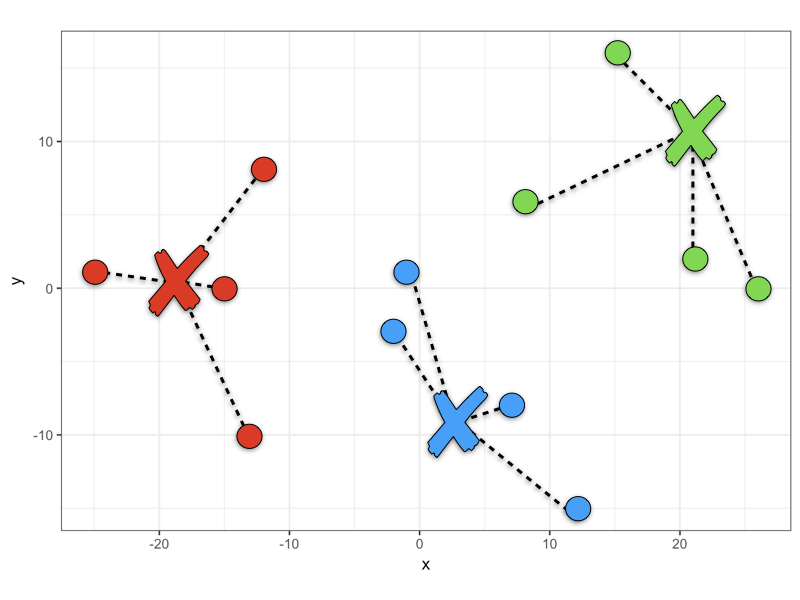
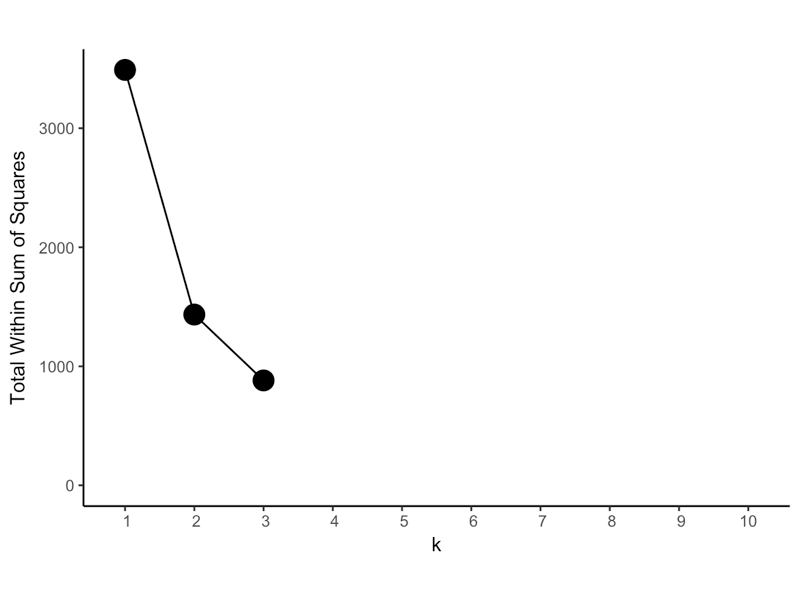
클러스터 내 총 제곱합: k = 3

R로 배우는 군집 분석

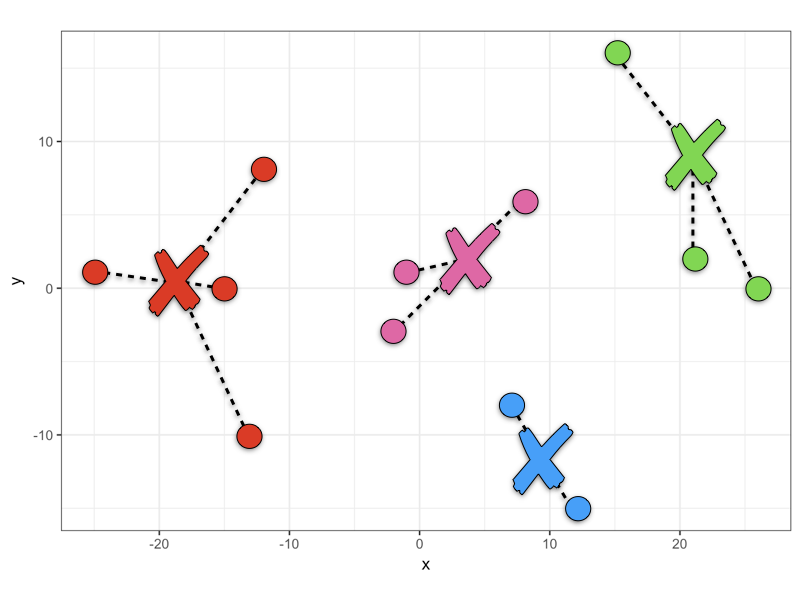
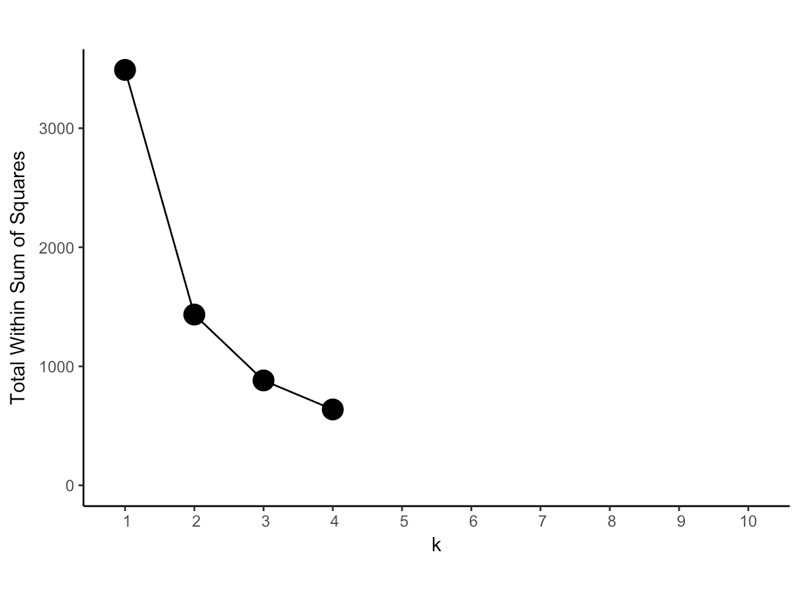
클러스터 내 총 제곱합: k = 4

R로 배우는 군집 분석

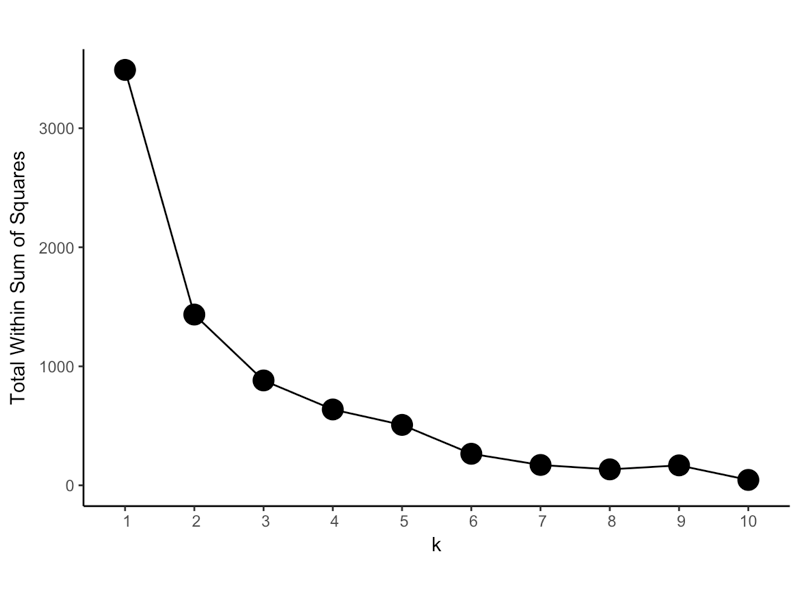
엘보 플롯

R로 배우는 군집 분석

엘보 플롯

R로 배우는 군집 분석

엘보 플롯 생성

model <- kmeans(x = lineup, centers = 2)
model$tot.withinss
[1] 1434.5
R로 배우는 군집 분석

엘보 플롯 생성

library(purrr)

tot_withinss <- map_dbl(1:10,  function(k){
  model <- kmeans(x = lineup, centers = k)
  model$tot.withinss
})

elbow_df <- data.frame( k = 1:10, tot_withinss = tot_withinss ) print(elbow_df)
    k tot_withinss
1   1    3489.9167
2   2    1434.5000
3   3     881.2500
4   4     637.2500
... ...   ...
R로 배우는 군집 분석

엘보 플롯 생성

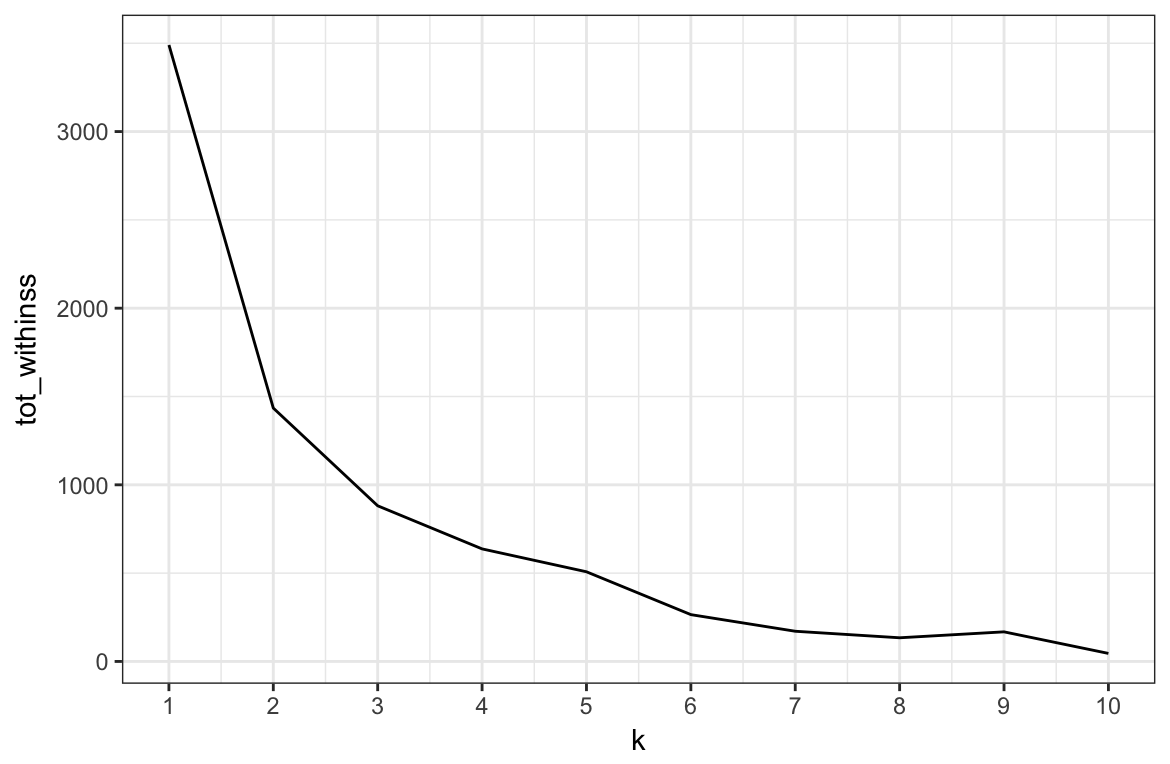
ggplot(elbow_df, aes(x = k, y = tot_withinss)) +
  geom_line() +
  scale_x_continuous(breaks = 1:10)
R로 배우는 군집 분석

연습해 봅시다!

R로 배우는 군집 분석

Preparing Video For Download...