Python으로 배우는 GARCH 모델
Chelsea Yang
Data Science Instructor
변동성은 직접 관측할 수 없습니다
GARCH는 잔차를 변동성 충격으로 사용합니다 $$ r_t = \mu_t + \epsilon_t $$
변동성은 잔차와 연결됩니다: $$ \epsilon_t = \sigma_t * \zeta (WhiteNoise)$$
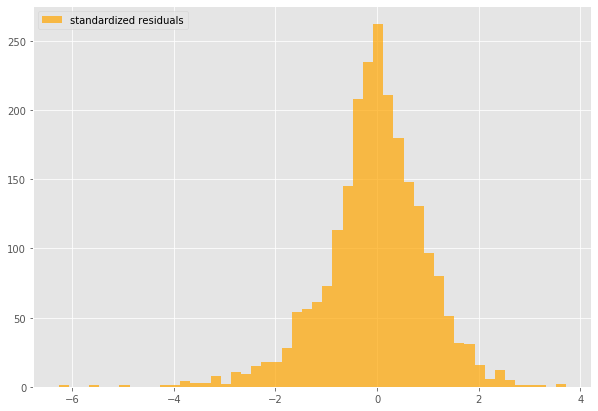
gm_std_resid = gm_result.resid / gm_result.conditional_volatility
plt.hist(gm_std_resid, facecolor = 'orange',label = 'standardized residuals')


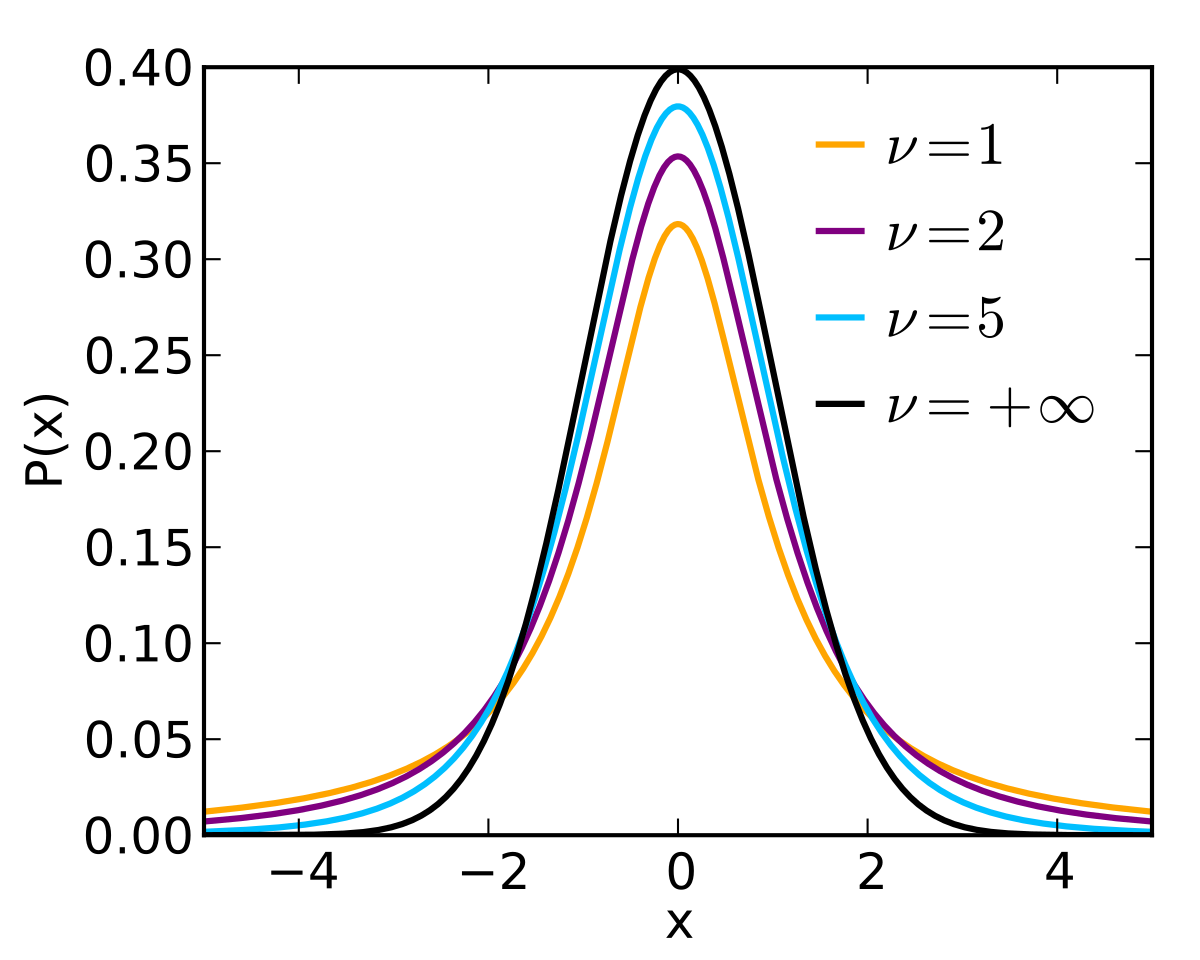
스튜던트 t-분포의 $\nu$ 모수는 분포의 모양을 결정합니다
arch_model(my_data, p = 1, q = 1,
mean = 'constant', vol = 'GARCH',
dist = 't')
Distribution
========================================================================
coef std err t P>|t| 95.0% Conf. Int.
.-----------------------------------------------------------------------
nu 4.9249 0.507 9.709 2.768e-22 [ 3.931, 5.919]
========================================================================
arch_model(my_data, p = 1, q = 1,
mean = 'constant', vol = 'GARCH',
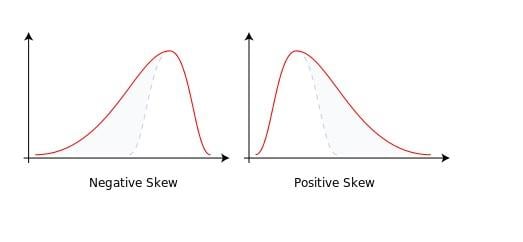
dist = 'skewt')
Distribution
===========================================================================
coef std err t P>|t| 95.0% Conf. Int.
.--------------------------------------------------------------------------
nu 5.2437 0.575 9.118 7.681e-20 [ 4.117, 6.371]
lambda -0.0822 2.541e-02 -3.235 1.216e-03 [ -0.132,-3.241e-02]
===========================================================================
Python으로 배우는 GARCH 모델