고차원 시계열
R로 시계열 데이터 시각화하기

Arnaud Amsellem
Quantitative Trader and creator of the R Trader blog
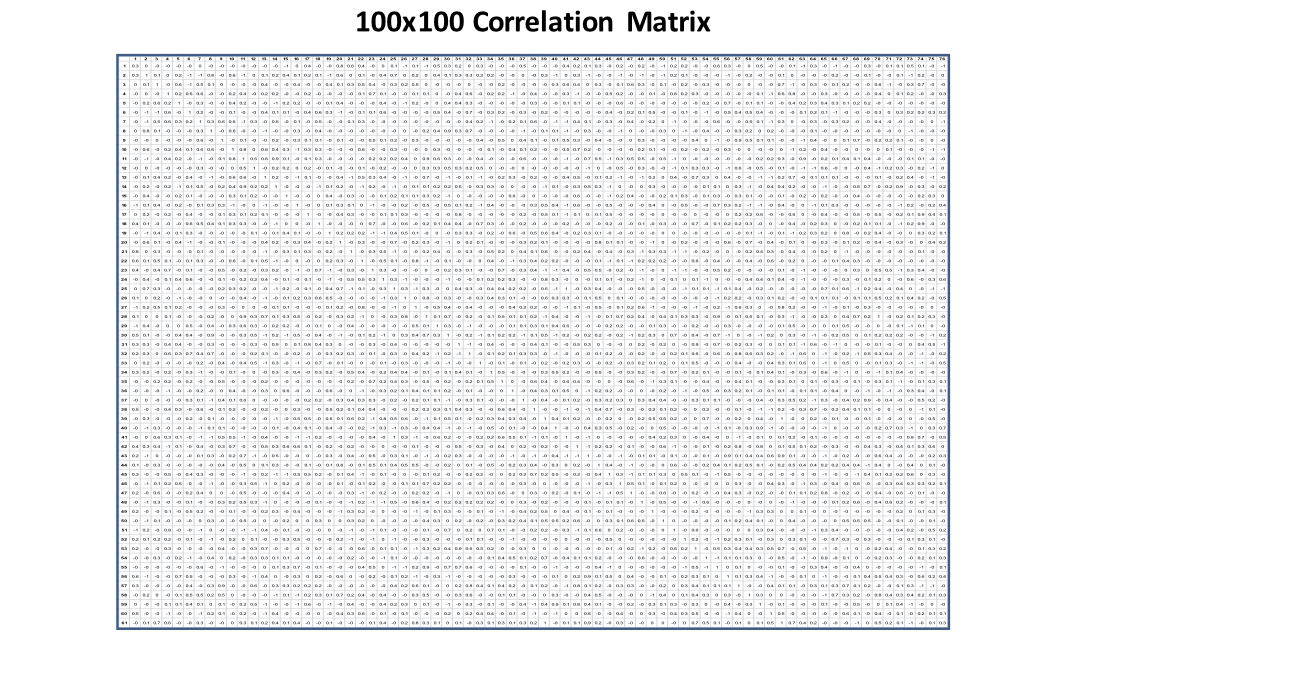
100 x 100 상관행렬
cor_mat
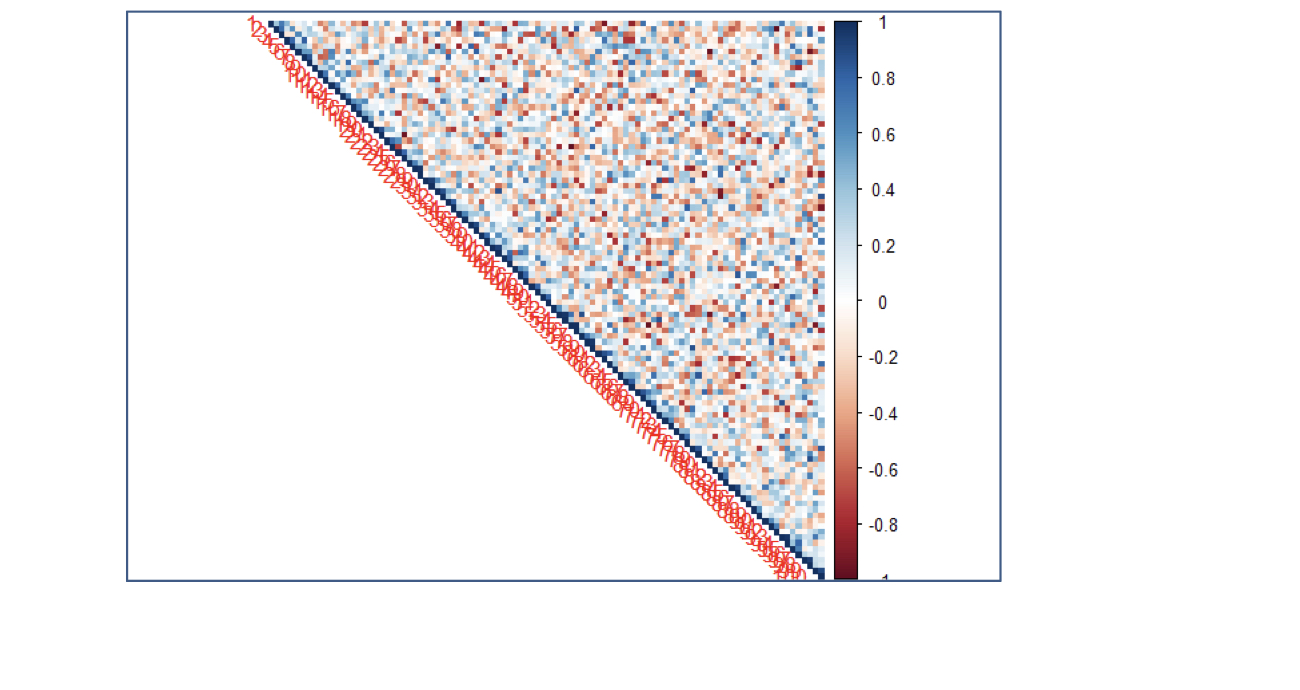
히트맵으로 본 상관행렬
corrplot(cor_mat, method = "color", type = "upper")
R로 시계열 데이터 시각화하기
Arnaud Amsellem
Quantitative Trader and creator of the R Trader blog
cor_mat
corrplot(cor_mat, method = "color", type = "upper")

