xts와 plot() 함수 복습
R로 시계열 데이터 시각화하기

Arnaud Amsellem
Quantitative Trader and creator of the R Trader blog
xts 복습
- 시계열을 다루는 특수 클래스
- eXtensible Time Series
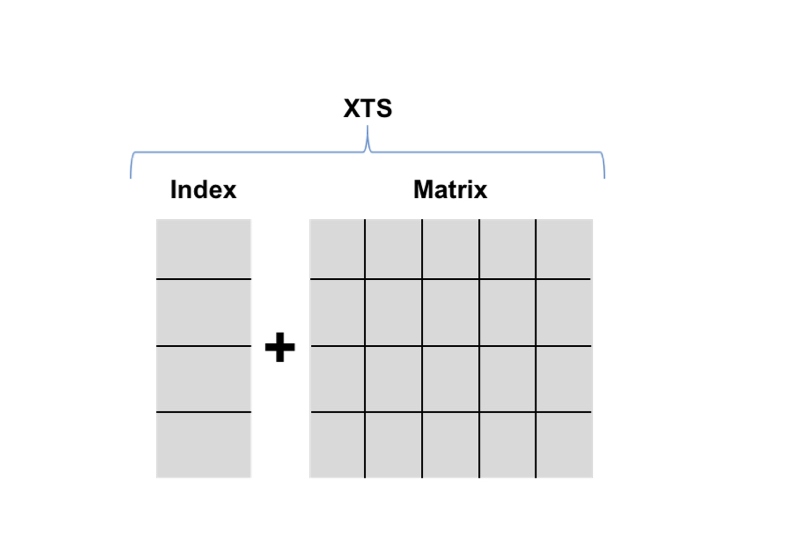
- xts = 시간 인덱스 + 행렬
- 인덱스는 시간 객체:
Date,POSIX Time,timeDate,chron
plot() 함수 사용하기
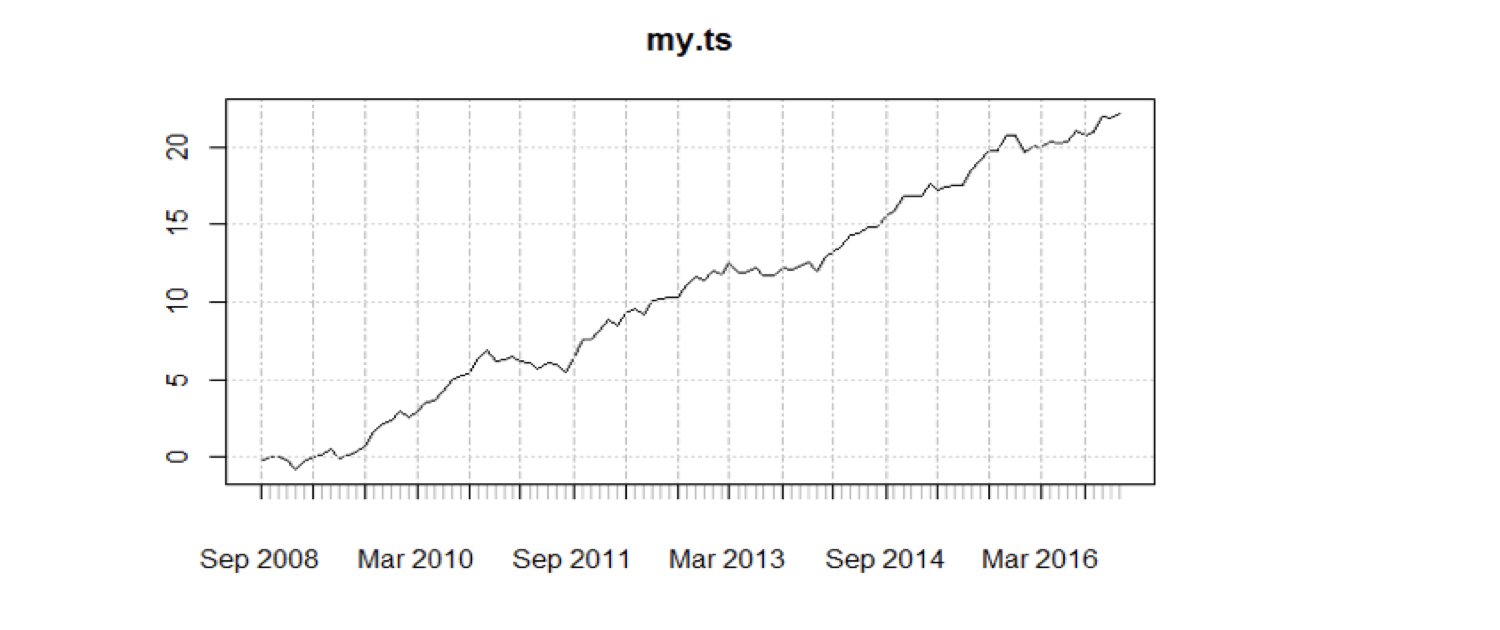
plot(my_ts)
plot() 함수 사용하기
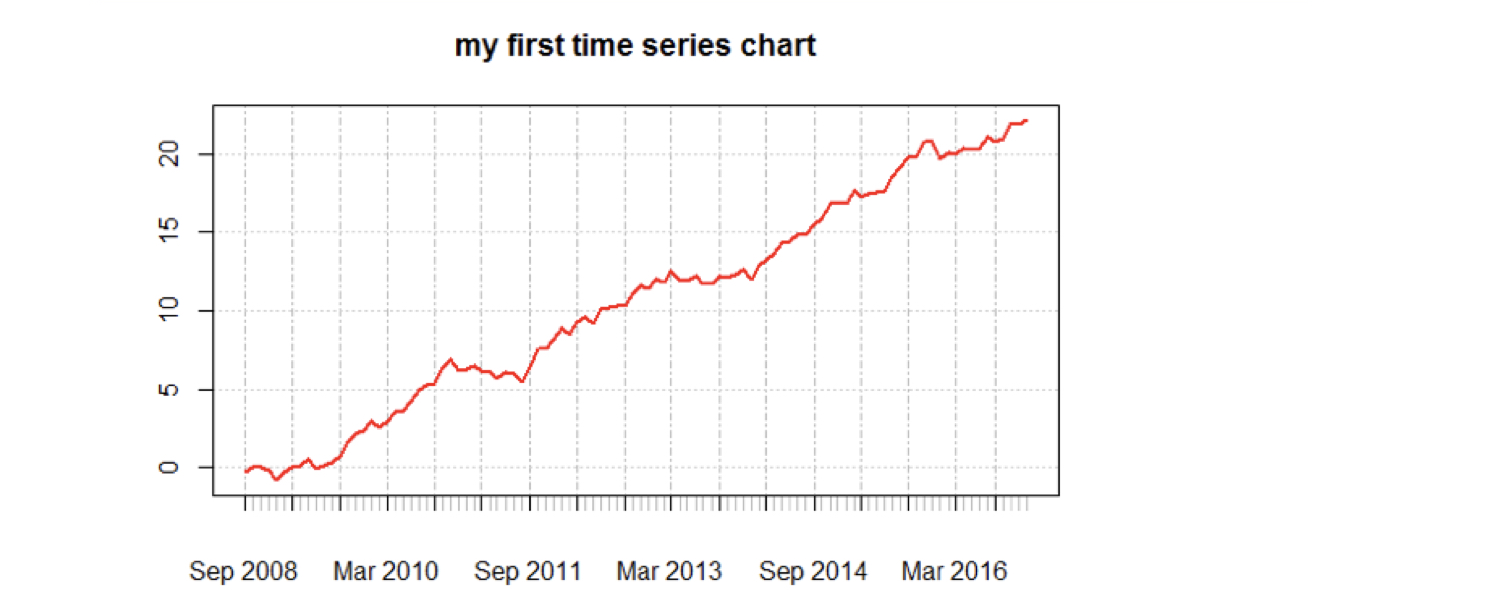
plot(my_ts, main = "my first time series")
lines(my_ts, col = "red", lwd = 2)
plot() 함수 사용하기
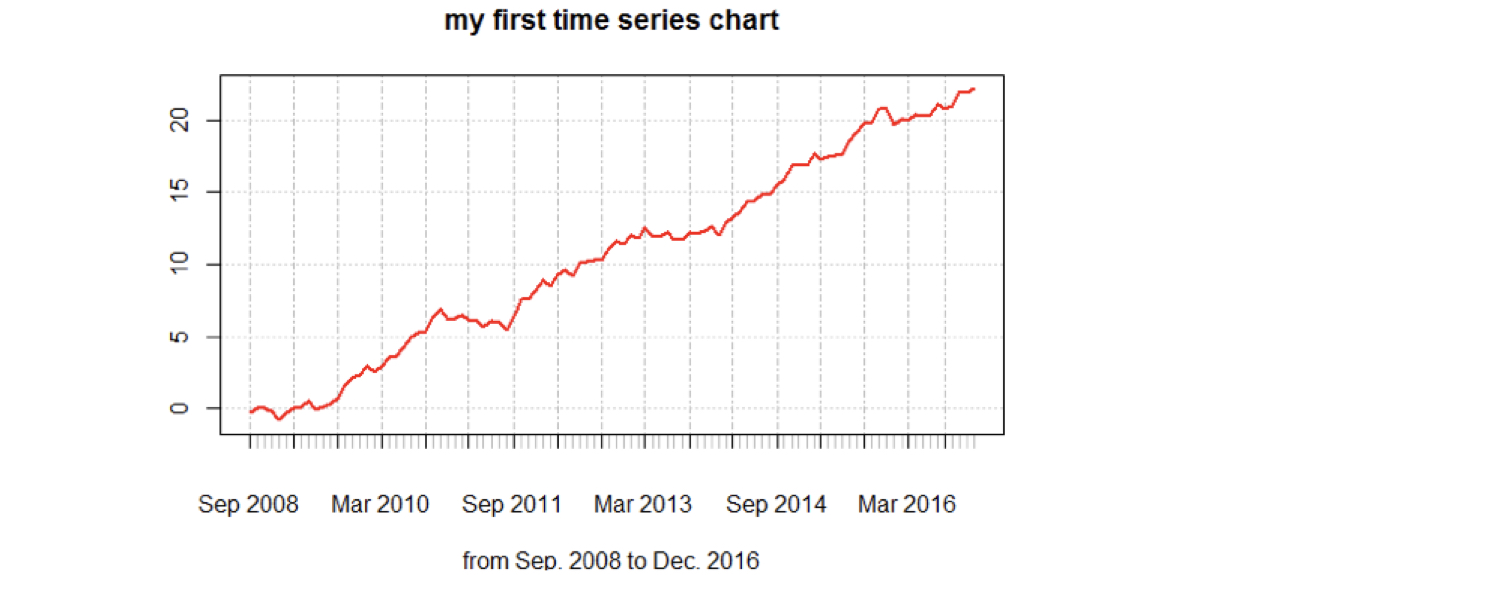
plot(my_ts, main = "my first time series",
            sub = "from Sep. 2008 to Dec. 2016")
lines(my_ts, col = "red", lwd = 2)

