plotly 소개

R로 배우는 plotly 인터랙티브 데이터 시각화

Adam Loy

Statistician, Carleton College

plotly

  • 인터랙티브 웹 기반 그래픽을 위한 시각화 라이브러리
  • 다양한 형식에서 사용 가능
    • 뷰어 창
    • R Markdown 문서
    • Shiny 앱
  • 활발한 개발 및 커뮤니티 지원
R로 배우는 plotly 인터랙티브 데이터 시각화

정적 그래픽 vs. 인터랙티브 그래픽

R로 배우는 plotly 인터랙티브 데이터 시각화

와인 데이터

library(dplyr)
glimpse(wine)
Rows: 178
Columns: 14
$ Type            <fct> 1, 1, 1, 1, 1, 1, 1, 1, 1, 1, 1, 1, 1, 1, 1, 1...
$ Alcohol         <dbl> 14.23, 13.20, 13.16, 14.37, 13.24, 14.20, 14.3...
$ Malic           <dbl> 1.71, 1.78, 2.36, 1.95, 2.59, 1.76, 1.87, 2.15...
...
$ Hue             <dbl> 1.04, 1.05, 1.03, 0.86, 1.04, 1.05, 1.02, 1.06...
$ Dilution        <dbl> 3.92, 3.40, 3.17, 3.45, 2.93, 2.85, 3.58, 3.58...
$ Proline         <int> 1065, 1050, 1185, 1480, 735, 1450, 1290, 1295,...
R로 배우는 plotly 인터랙티브 데이터 시각화

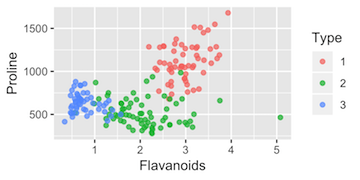
ggplot2 산점도

library(ggplot2)
static <- wine %>%
  ggplot(aes(x = Flavanoids, y = Proline, color = Type)) +
  geom_point()
  • 데이터셋, wine
  • 미학 매핑, aes()
  • 레이어 추가, geom_point()
R로 배우는 plotly 인터랙티브 데이터 시각화

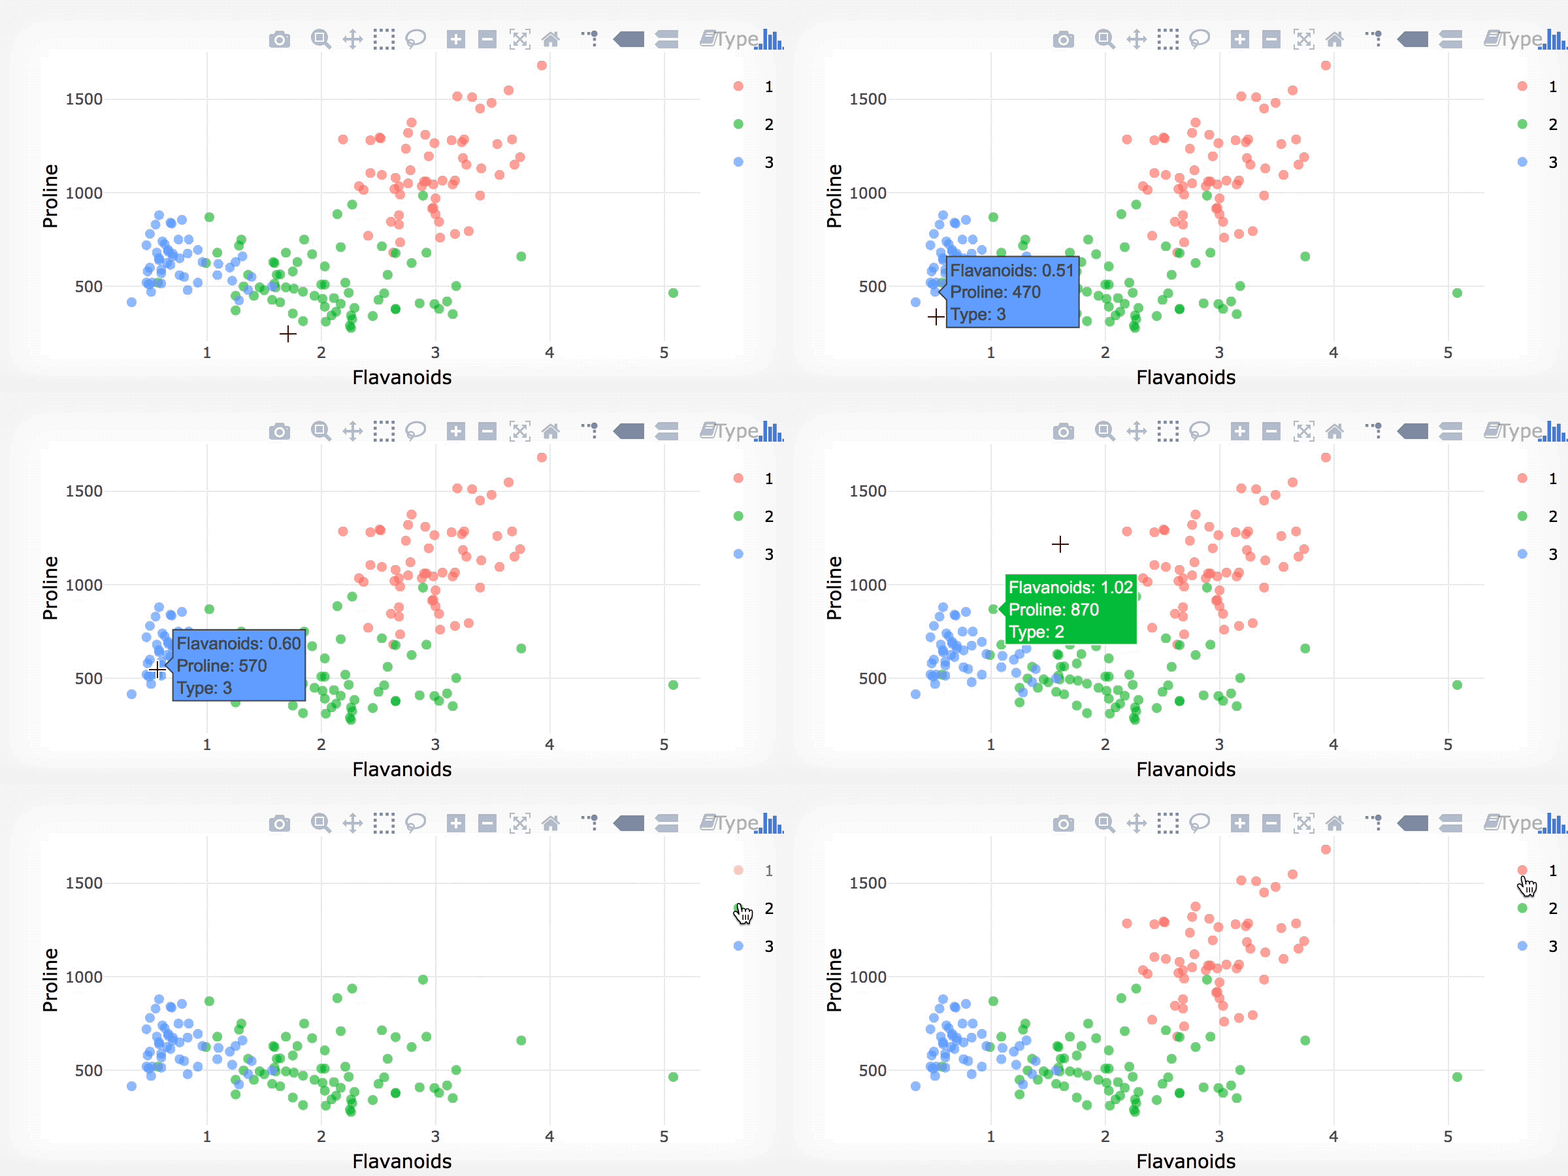
ggplotly()

library(plotly)
ggplotly(static)

R로 배우는 plotly 인터랙티브 데이터 시각화

주의 사항

  • 인터랙티브 ≠ 좋은 그래프

    • 잘못된 설계 = 나쁜 인터랙티브 그래픽
    • 데이터 시각화 모범 사례 준수
  • ggplotly()는 시작에 불과합니다

R로 배우는 plotly 인터랙티브 데이터 시각화

연습해 봅시다!

R로 배우는 plotly 인터랙티브 데이터 시각화

Preparing Video For Download...