단일 변수 그리기

R로 배우는 plotly 인터랙티브 데이터 시각화

Adam Loy

Statistician, Carleton College

와인 데이터 탐색

library(dplyr)
glimpse(wine)
Rows: 178
Columns: 14
$ Type            <fct> 1, 1, 1, 1, 1, 1, 1, 1, 1, 1, 1, 1, 1, 1, 1, 1...
$ Alcohol         <dbl> 14.23, 13.20, 13.16, 14.37, 13.24, 14.20, 14.3...
$ Malic           <dbl> 1.71, 1.78, 2.36, 1.95, 2.59, 1.76, 1.87, 2.15...
...
$ Hue             <dbl> 1.04, 1.05, 1.03, 0.86, 1.04, 1.05, 1.02, 1.06...
$ Dilution        <dbl> 3.92, 3.40, 3.17, 3.45, 2.93, 2.85, 3.58, 3.58...
$ Proline         <int> 1065, 1050, 1185, 1480, 735, 1450, 1290, 1295,...
R로 배우는 plotly 인터랙티브 데이터 시각화

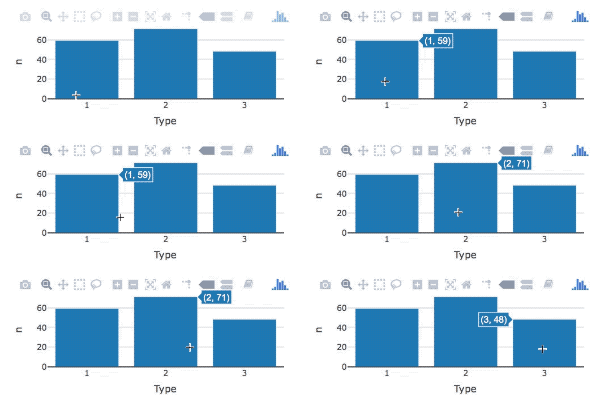
plotly로 막대 그래프 만들기

막대 그래프 애니메이션

library(plotly)

wine %>%
   count(Type) %>%                 
   plot_ly(x = ~Type, y = ~n) %>% 
   add_bars()
  • count()로 도수표 생성
  • ~로 미적 요소 지정
  • add_bars()로 막대 트레이스 추가
R로 배우는 plotly 인터랙티브 데이터 시각화

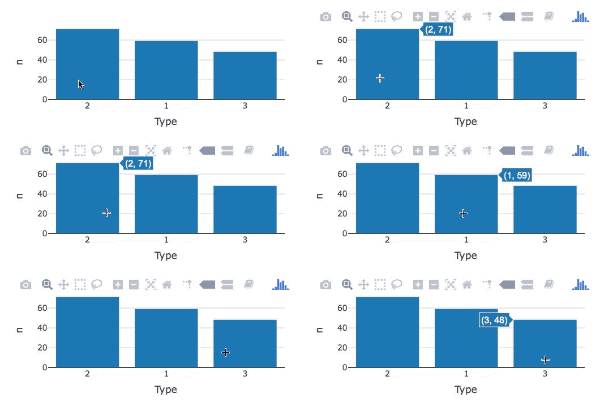
막대 순서 재정렬

막대 순서 변경 애니메이션

library(forcats)
wine %>%
  count(Type) %>%                 
  mutate(Type = fct_reorder(Type, n, .desc = TRUE)) %>% 
  plot_ly(x = ~Type, y = ~n) %>%
  add_bars()
  • 막대 순서 변경: fct_reorder()
  • .desc 인수를 TRUE로 설정
R로 배우는 plotly 인터랙티브 데이터 시각화

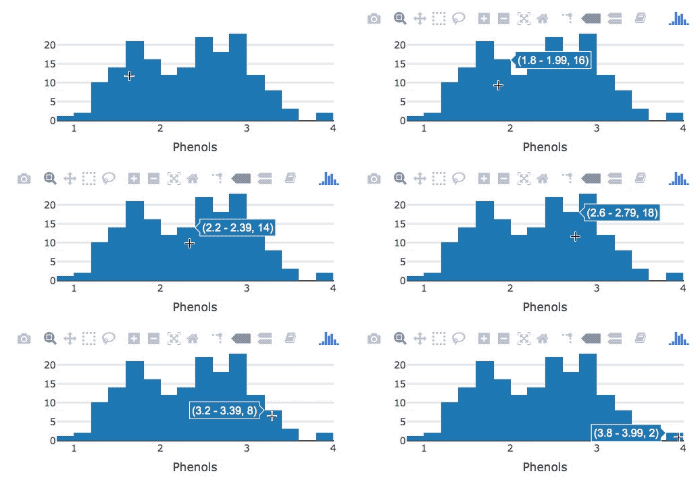
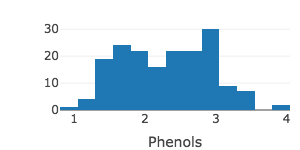
plotly로 히스토그램 만들기

히스토그램 애니메이션

wine %>%
   plot_ly(x = ~Phenols) %>%  # 미적 요소 지정

add_histogram() # 히스토그램 트레이스 추가
R로 배우는 plotly 인터랙티브 데이터 시각화

빈 개수 조정

wine %>%
   plot_ly(x = ~Phenols) %>% 
   add_histogram(nbinsx = 10)
R로 배우는 plotly 인터랙티브 데이터 시각화

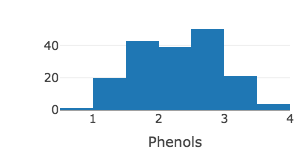
빈 너비 조정

wine %>%
   plot_ly(x = ~Phenols) %>% 
   add_histogram(xbins = list(start = 0.8, end = 4, size = 0.25))
R로 배우는 plotly 인터랙티브 데이터 시각화

Ayo berlatih!

R로 배우는 plotly 인터랙티브 데이터 시각화

Preparing Video For Download...