데이터 품질 점검과 요약 통계

Python으로 Machine Learning 모니터링

Hakim Elakhrass

Co-founder and CEO of NannyML

데이터 품질 점검과 요약 통계란?
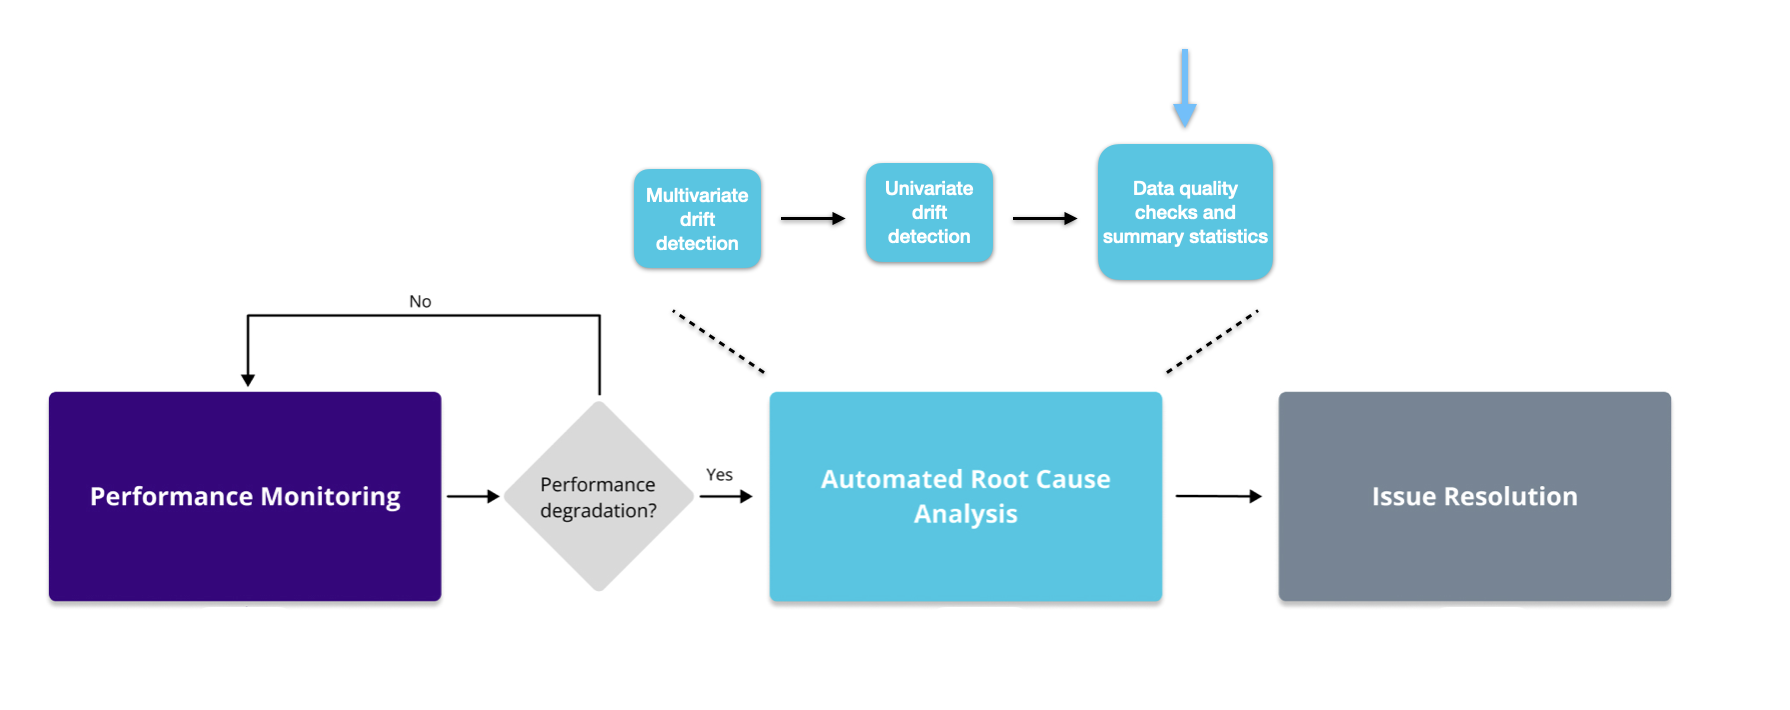
이미지는 모니터링 워크플로우에서 자동 원인 분석 단계의 데이터 품질 점검과 요약 통계 부분을 강조합니다.

  • 결측값 탐지
  • 미관측값 탐지
  • 합계, 평균, 표준편차, 중앙값, 행 수
Python으로 Machine Learning 모니터링

결측값 탐지

  • 청크 내 관측치 감소
  • 유의미한 정보 손실
  • 잘못된 해석과 의사결정
# Instantiate the missing values calculator module
ms_calc = nannyml.MissingValuesCalculator(column_names=["Age"], normalize=True)

# Fit the calculator on the reference set
ms_calc.fit(reference)

# Calculate the rate of the missing values on the analysis set
ms_results = ms_calc.calculate(analysis)
ms_results.plot()
Python으로 Machine Learning 모니터링

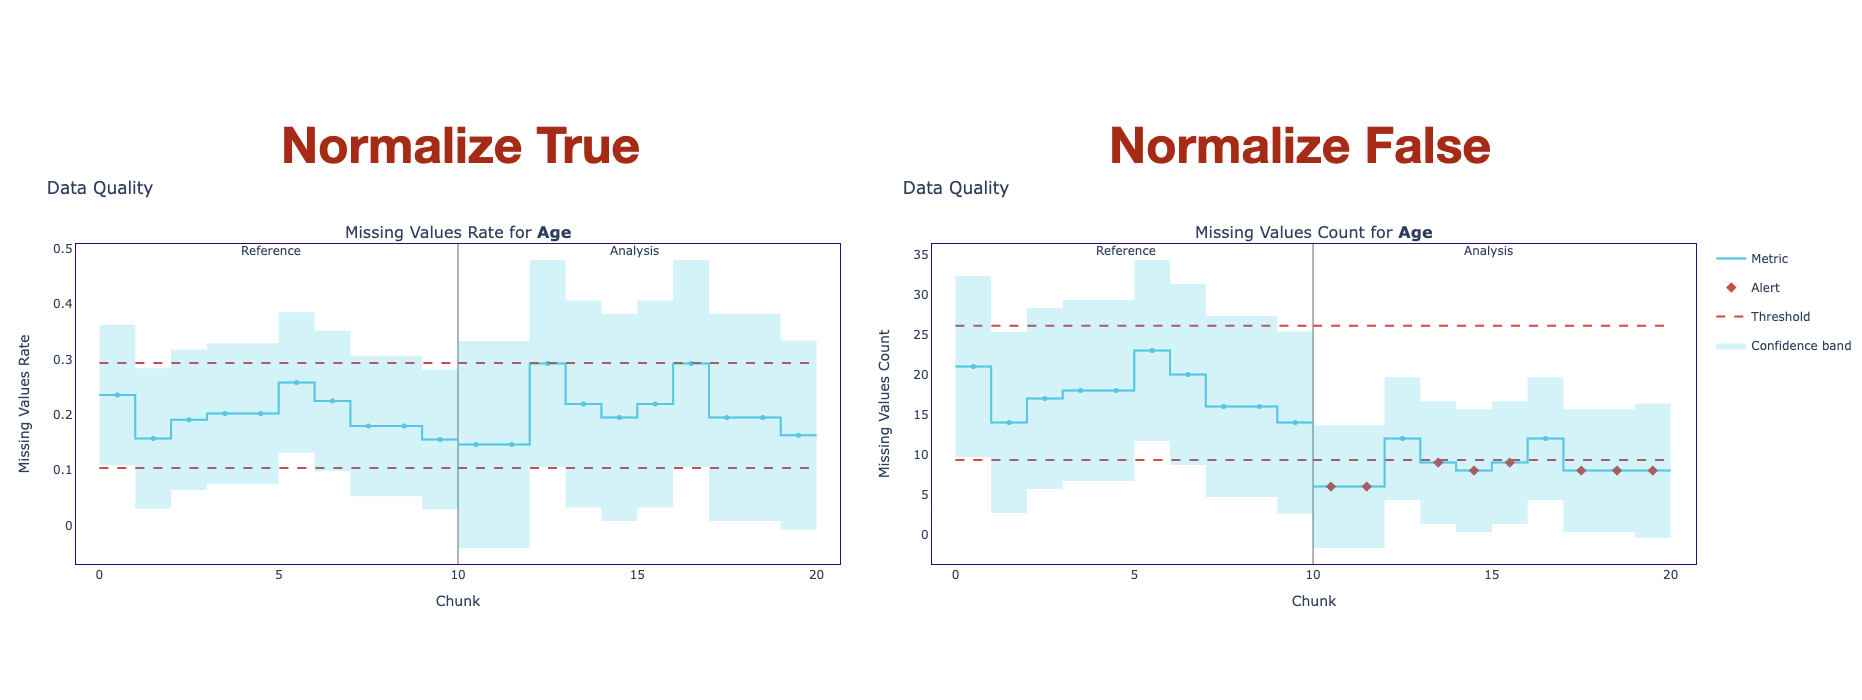
결측값 그래프

그래프는 normalize 파라미터를 True와 False로 설정했을 때의 결측값 결과를 보여줍니다.

Python으로 Machine Learning 모니터링

미관측값 탐지

  • 기준 기간에 존재하지 않는 범주형 값
  • 미관측값 증가 시 특정 구간에서 모델 신뢰도가 낮아질 수 있습니다.
# Instantiate the unseen values calculator module
us_calc = nannyml.UnseenValuesCalculator(column_names=["Cabin"], normalize=False)
# Fit, calculate and plot the rate of the unseen values
us_calc.fit(reference)
us_results = us_calc.calculate(analysis)
us_results.plot()
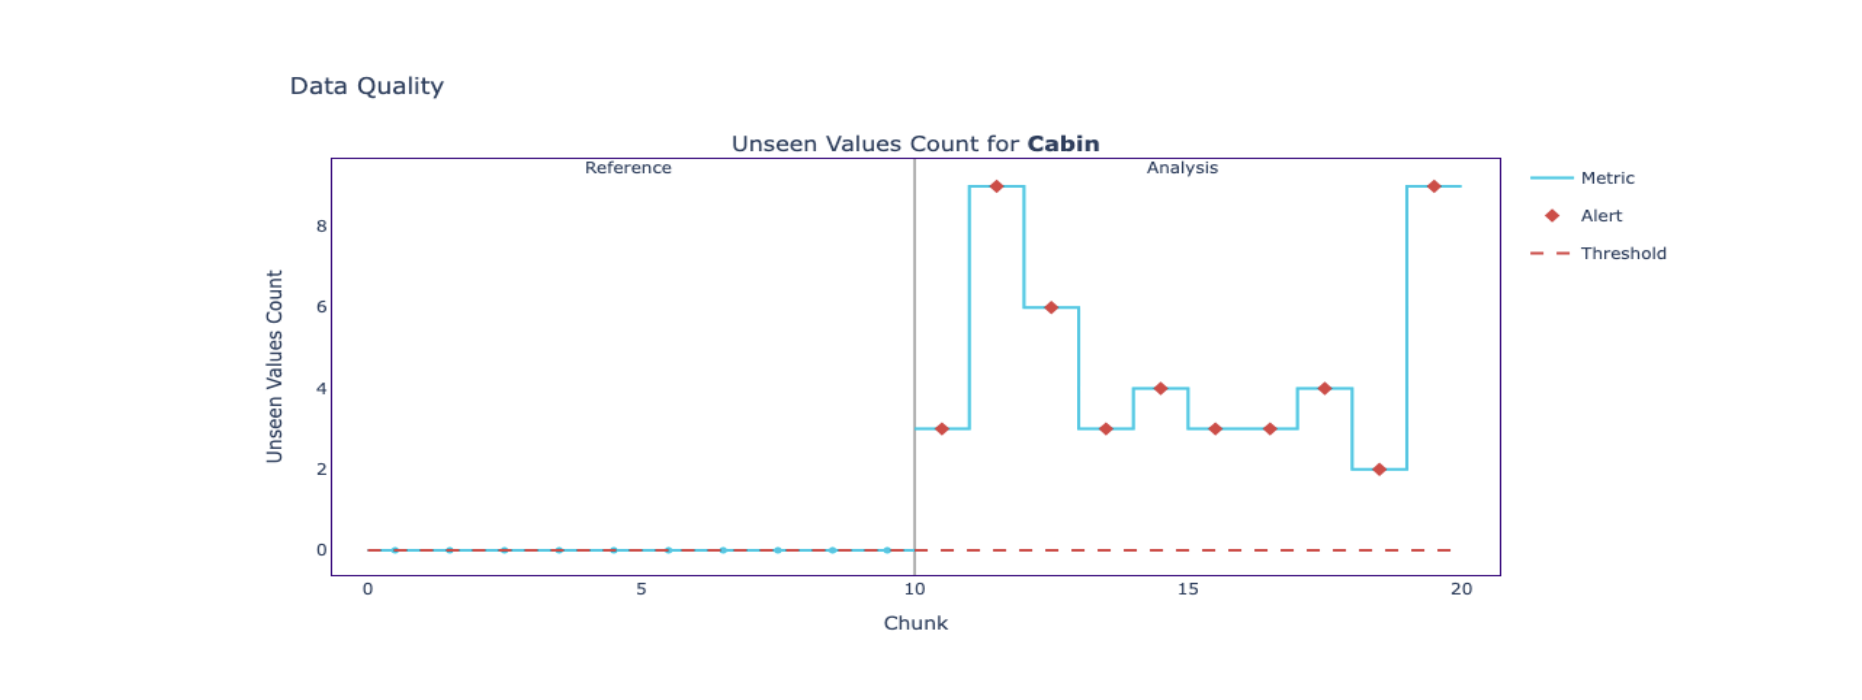
이미지는 미관측값 수 변화가 보이는 미관측값 그래프를 보여줍니다.

Python으로 Machine Learning 모니터링

요약 통계

  • 합계: 특정 기간의 매출·이익 계산 등 재무 데이터에 유용합니다.
  • 평균표준편차: 데이터 드리프트 점검과 설명 가능성에 도움됩니다.
  • 중앙값: 이상치에 강해 극단값이 많은 특성에 유용합니다.
  • 행 수: 각 청크에 데이터가 충분한지 확인합니다.
sum_calc = nannyml.SummaryStatsSumCalculator(column_names=selected_columns)
avg_calc = nannyml.SummaryStatsAvgCalculator(column_names=selected_columns)
std_calc = nannyml.SummaryStatsStdCalculator(column_names=selected_columns)
med_calc = nannyml.SummaryStatsMedianCalculator(column_names=selected_columns)
rows_calc = nannyml.SummaryStatsRowCountCalculator(column_names=selected_columns)
Python으로 Machine Learning 모니터링

연습해 봅시다!

Python으로 Machine Learning 모니터링

Preparing Video For Download...