단변량 드리프트 탐지

Python으로 Machine Learning 모니터링

Hakim Elakhrass

CEO and co-founder

단변량 드리프트 탐지란?
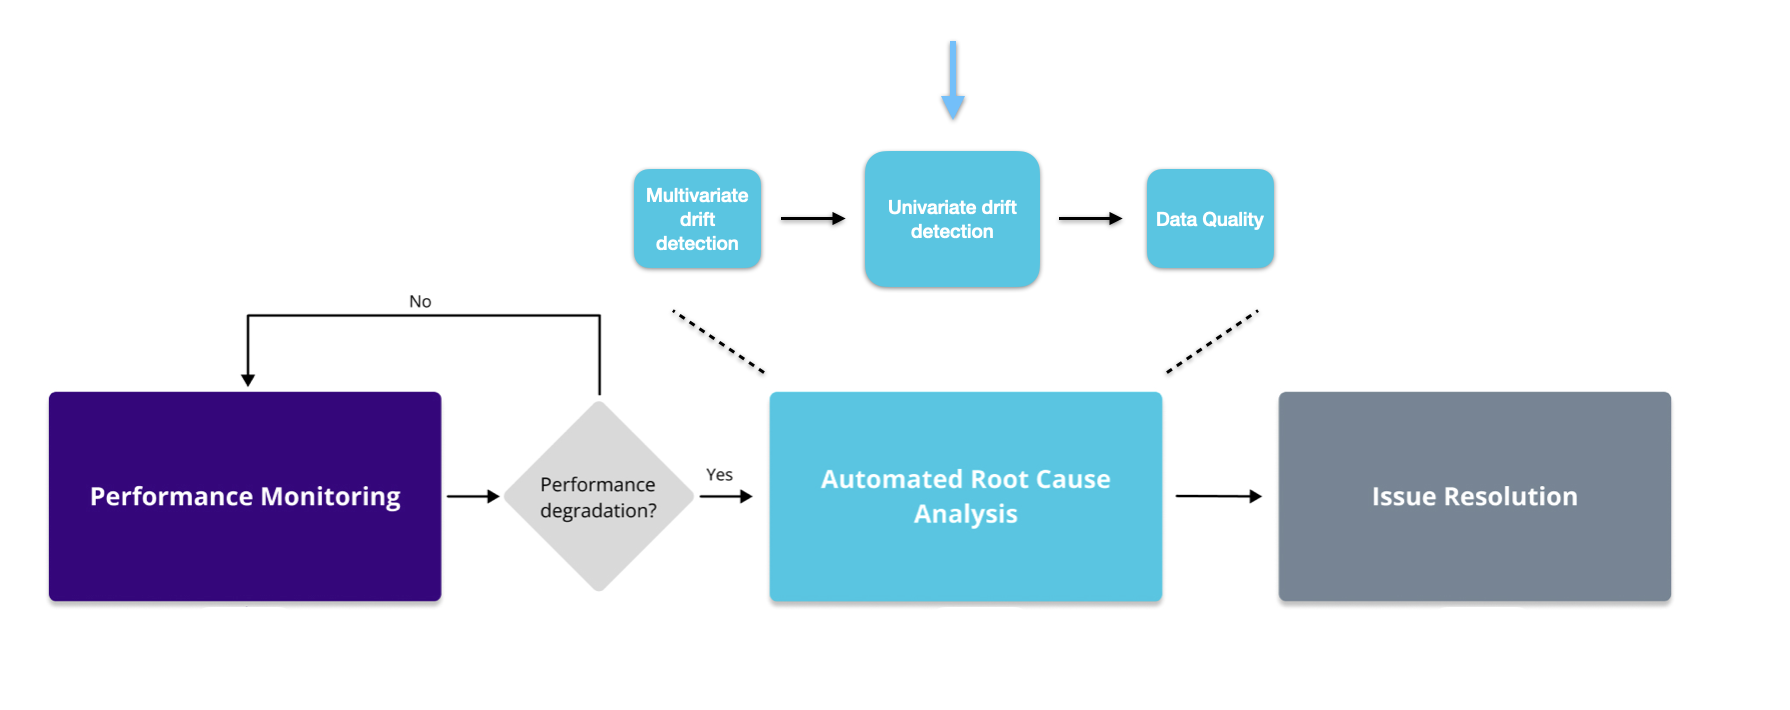
이미지는 모니터링 워크플로와 그 안에서 단변량 방법의 위치를 보여줍니다.

Python으로 Machine Learning 모니터링

단변량 방법

  • Jensen-Shannen 거리 - 범주형 및 연속형
  • Hellinger - 범주형 및 연속형
  • Wasserstein - 연속형만
  • Kolgomorov-Smirnov - 연속형만

  • L-무한대 - 범주형만

  • 카이제곱(Chi2) - 범주형만

1 https://nannyml.readthedocs.io/en/stable/how_it_works/univariate_drift_comparison.html
Python으로 Machine Learning 모니터링

코드 구현

# Intialize the univariate drift calculator
uv_calc = nannyml.UnivariateDriftCalculator(
    continuous_methods=['wasserstein', 'hellinger'],
    categorical_methods=['jensen_shannon', 'l_infinity', 'chi2'],
    column_names=feature_column_names,
    timestamp_column_name='timestamp',
    chunk_period='d'
    )
# Fit, calculate and plot the results
uv_calc.fit(reference)
uv_results = uv_calc.calculate(analysis)
uv_results.plot().show()
Python으로 Machine Learning 모니터링

필터링

  • 열 이름 기준
  • 단변량 방법 기준
# Filter the univariate results
filtered_figure = uv_results.filter(column_names=['trip_distance', 'fare_amount'], 
            methods=['jensen_shannon'])

# Plot the filtered results
filtered_figure.show().plot()
Python으로 Machine Learning 모니터링

경고 수 랭커

  • 경고 횟수 기준으로 특성 순위 지정
# Initialize the alert count ranker
alert_count_ranker = nannyml.AlertCountRanker()
alert_count_ranked_results = alert_count_ranker.rank(
    uv_results,
    only_drifting=False)
# Display the results
display(alert_count_ranked_results)
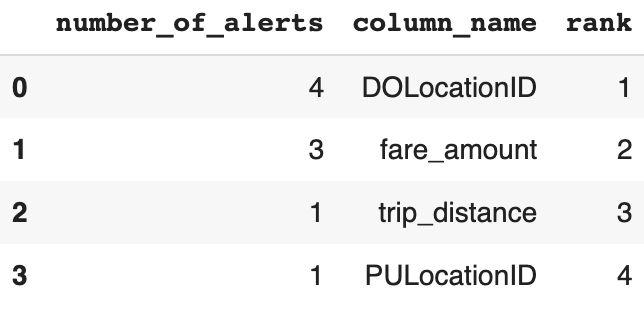
이미지는 특정 특성의 경고 수가 담긴 데이터프레임을 보여줍니다.

Python으로 Machine Learning 모니터링

상관 랭커

  • 성능 절대 변화와의 상관 정도로 특성 순위 지정
# Initialize the correlation ranker
correlation_ranker = nannyml.CorrelationRanker()
correlation_ranker.fit(perf_results.filter(period='reference'))
correlation_ranked_results = correlation_ranker.rank(uv_results, perf_results)

# Display the results
display(correlation_ranked_results)
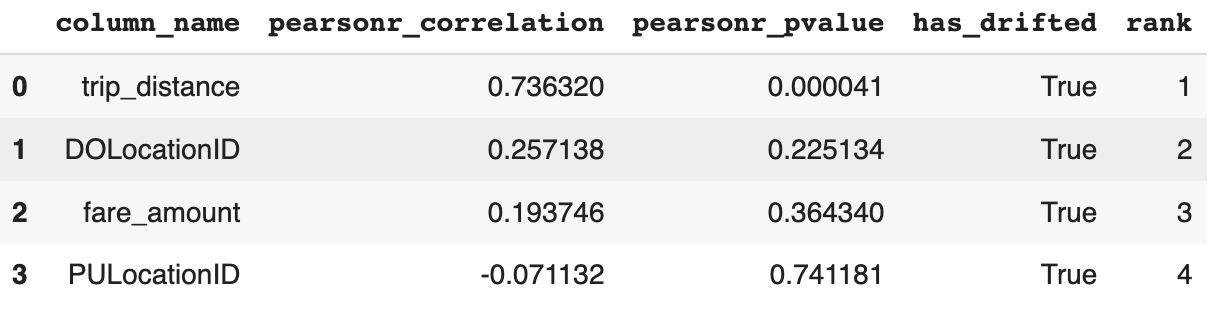
이미지는 각 특성의 피어슨 상관계수와 p-값이 담긴 데이터프레임을 보여줍니다.

Python으로 Machine Learning 모니터링

특성 분포 모니터링

  • 인사이트 향상 및 설명력 개선
# Create distribution plots
distribution_results = uv_results.plot(kind='distribution')

# Show the plots
distribution_results.show()
Python으로 Machine Learning 모니터링

특성 분포 플롯


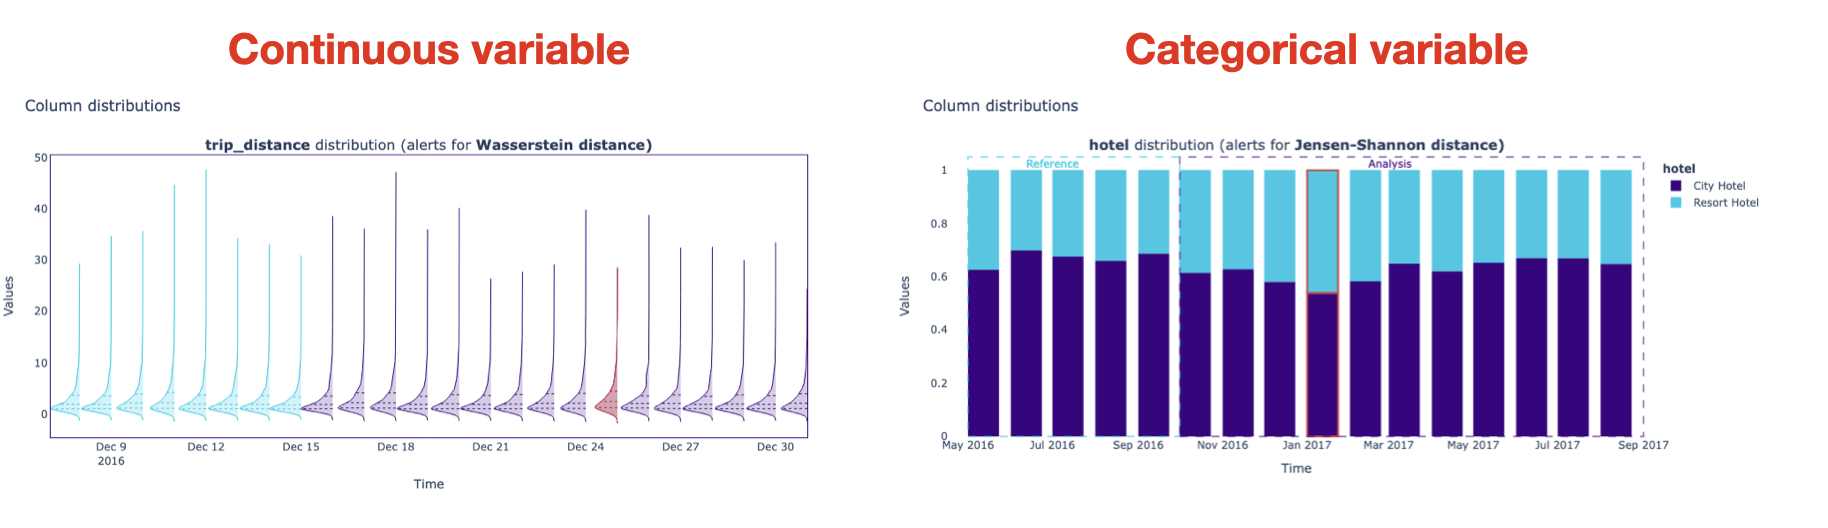
이미지는 연속형과 범주형 특성의 분포 플롯을 보여줍니다.

Python으로 Machine Learning 모니터링

연습해 봅시다!

Python으로 Machine Learning 모니터링

Preparing Video For Download...