Python으로 Machine Learning 모니터링
Maciej Balawejder
Data Scientist
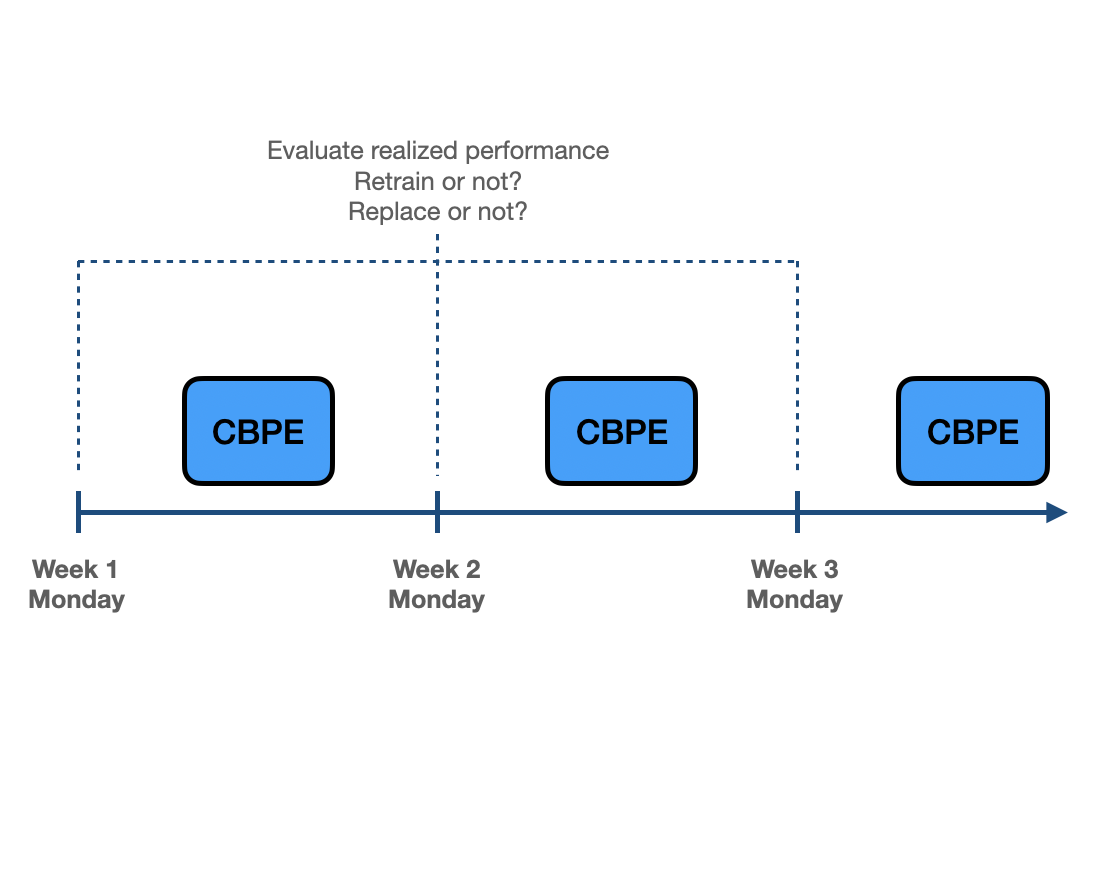
추정 성능:
모델의 예상 성능을 측정
CBPE, DLE 같은 추정기로 산출
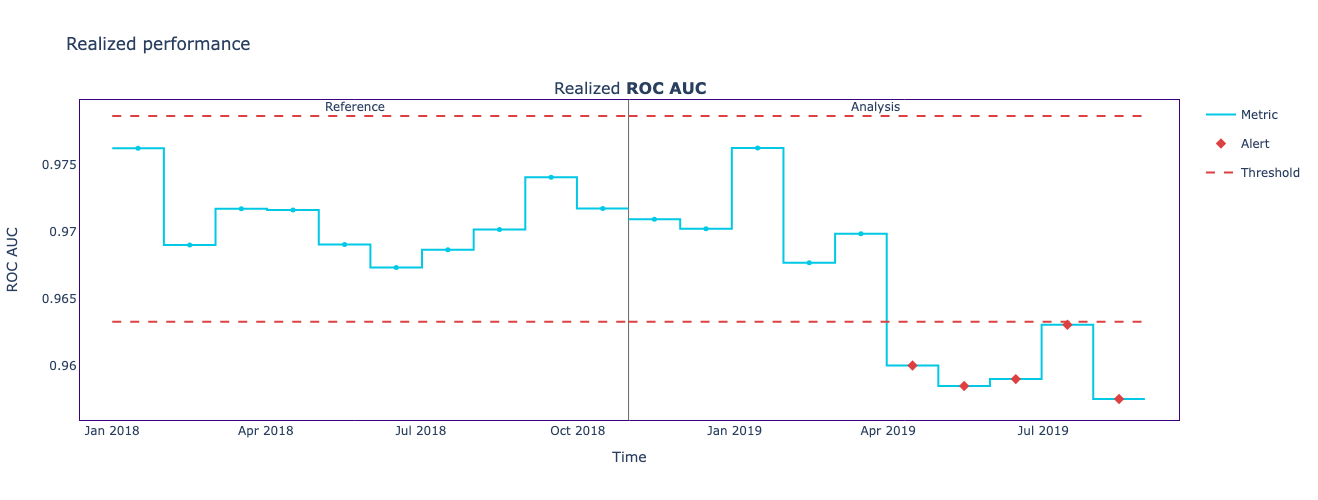
실측 성능:
# Intialize the calculator
calc = nannyml.PerformanceCalculator(
    y_pred_proba='y_pred_proba',
    y_pred='y_pred',
    y_true='arrived',
    timestamp_column_name='timestamp',
    problem_type='classification_binary',
    chunk_period='d',
    metrics=['roc_auc', 'accuracy'],
    )
# Fit the calculator
calc.fit(reference)
realized_results = calc.calculate(analysis)
# Show realized performance plot
results.plot().show()
# Estimate and calculate results
estimated_results = estimator.estimate(analysis)
realized_results = calculator.calculate(analysis)


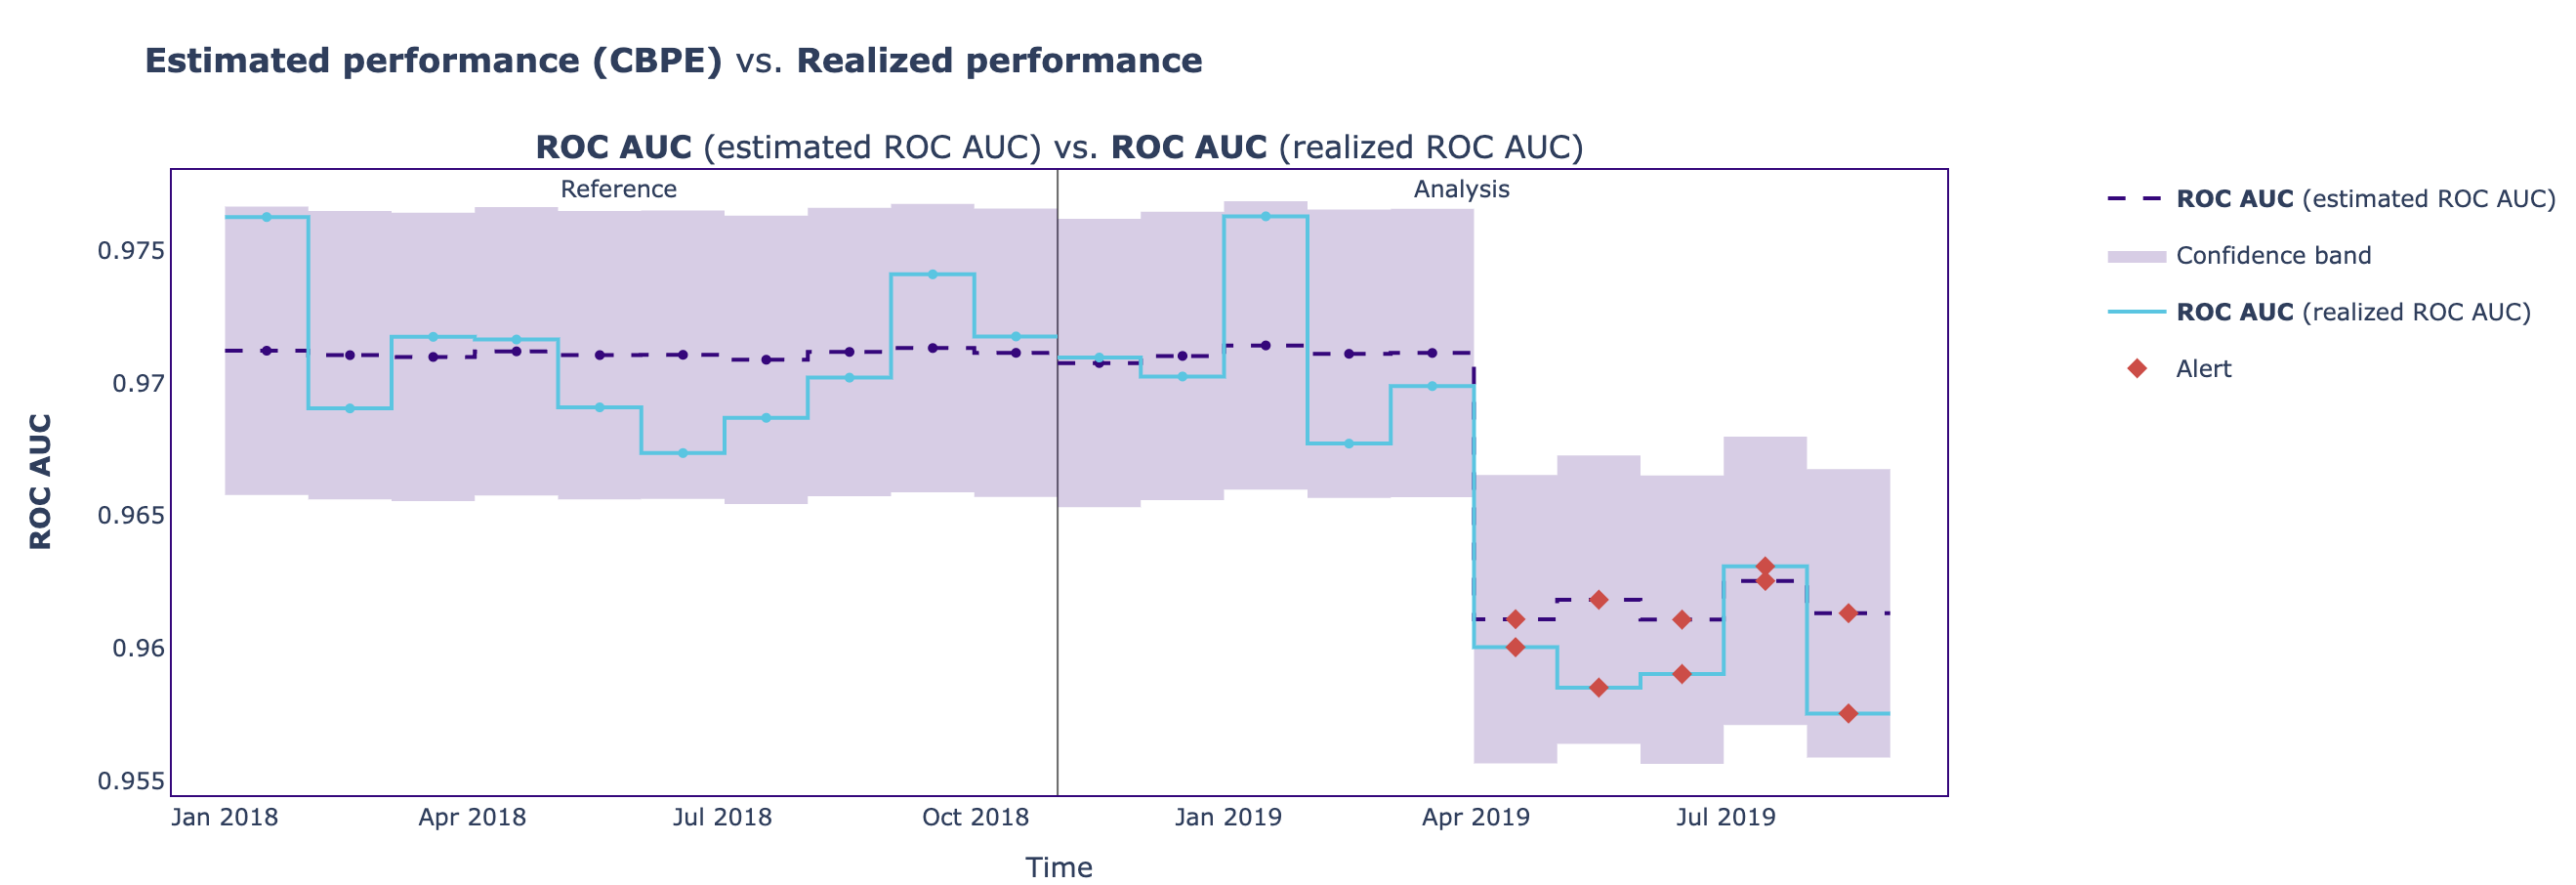
# Show comparison plot
realized_results.compare(estimated_results).plot().show()
# Estimate and calculate results estimated_results = estimator.estimate(analysis) realized_results = calculator.calculate(analysis)
# Show comparison plot realized_results.compare(estimated_results).plot().show()