계산 및 추정 결과 다루기

Python으로 Machine Learning 모니터링

Maciej Balawejder

Data Scientist

데이터를 어떻게 청크로 나눌까요?
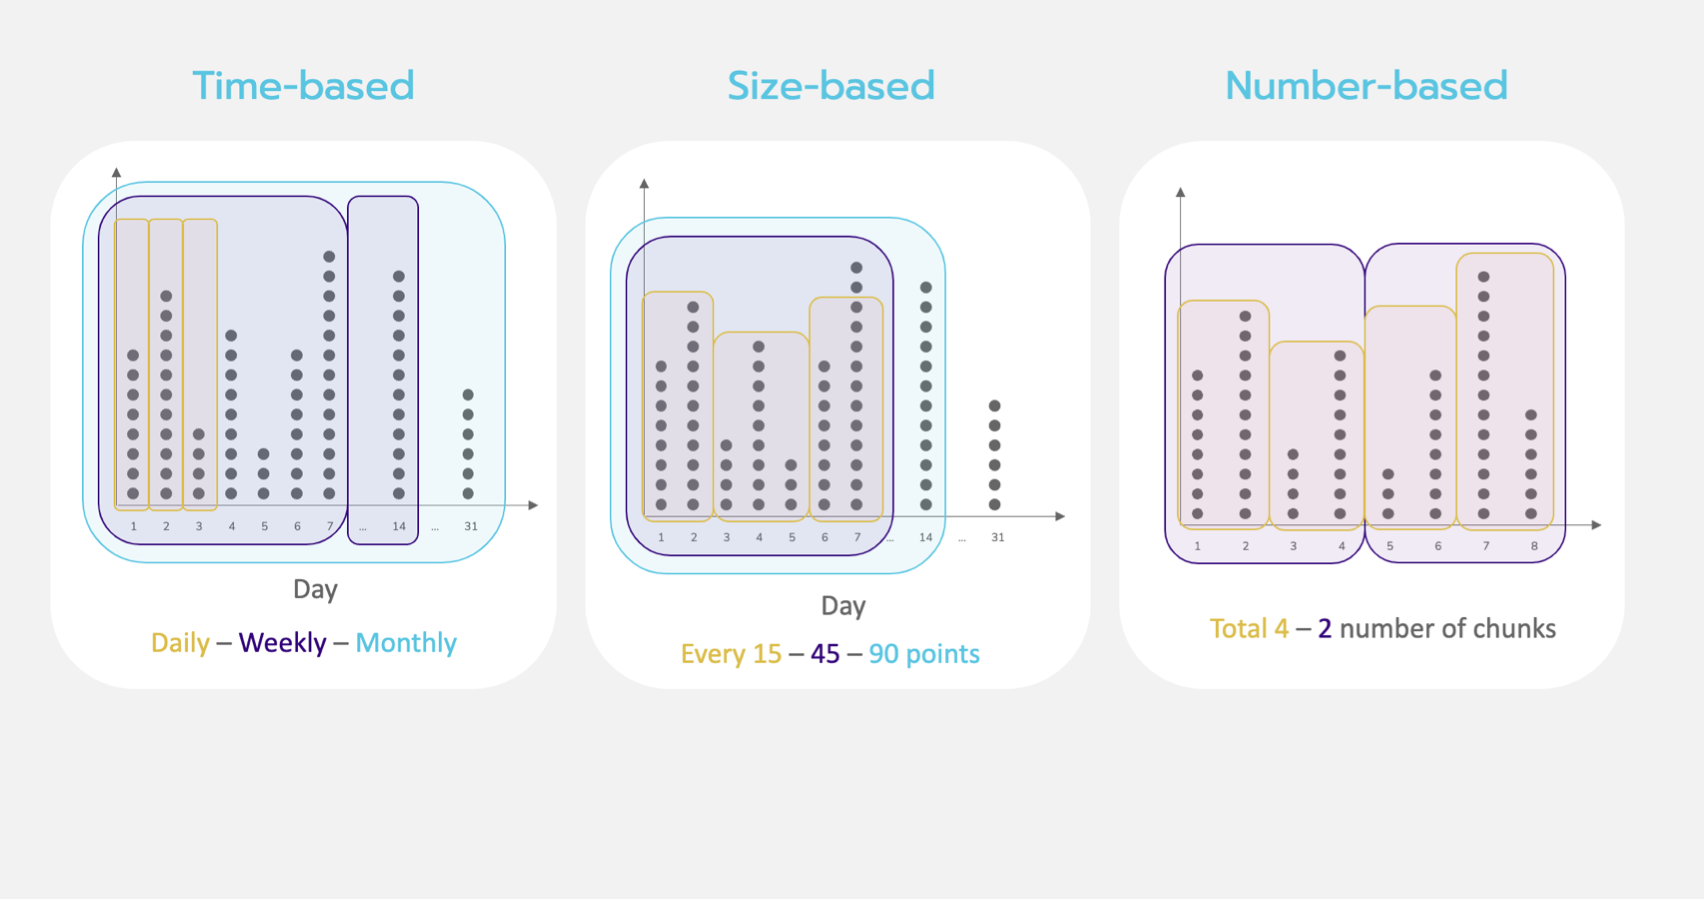
이미지는 세 가지 청킹 방식: 유형 기준, 크기 기준, 개수 기준을 보여 줍니다.

Python으로 Machine Learning 모니터링

다양한 청크 지정

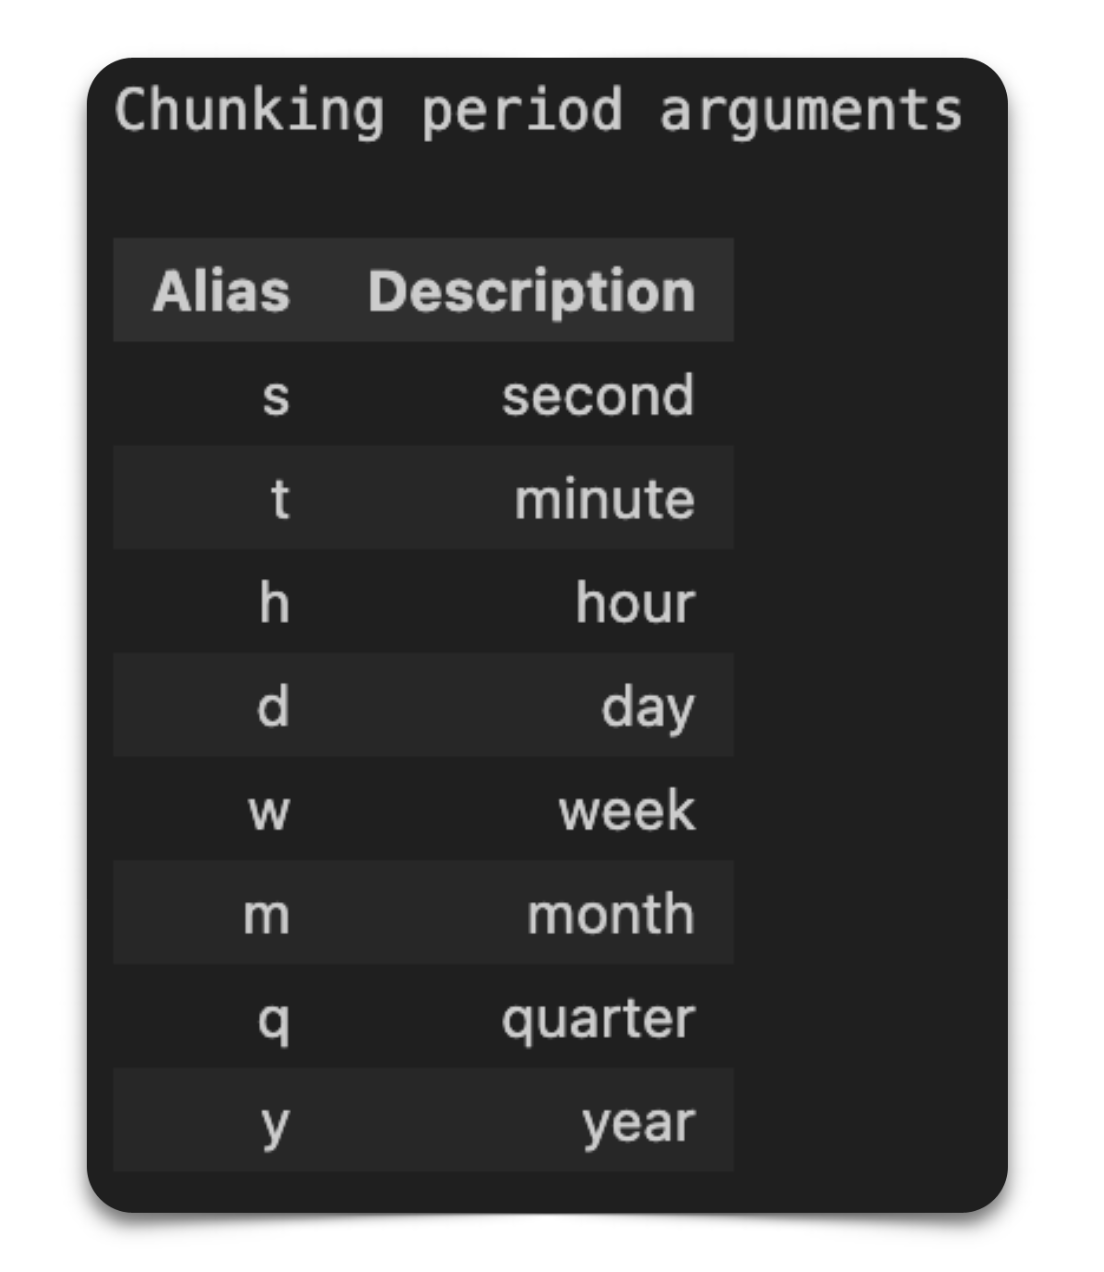
이미지는 청크 기간 인자로 전달할 수 있는 시간 기준 청킹 별칭을 보여 줍니다.

# 알고리즘 초기화
cbpe = nannyml.CBPE(
   problem_type='classification_binary',
   y_pred_proba='predicted_probability',
   y_pred='prediction',
   y_true='employed',
   metrics=['roc_auc'],
   chunk_period='m',
   # chunk_size = 5000, 
   # chunk_number = 10
)
Python으로 Machine Learning 모니터링

사용자 지정 임계값 초기화

표준편차 임계값

  • 하한/상한 표준편차 배수를 수동 설정
# 표준편차 임계값
stdt = StandardDeviationThreshold(
    std_lower_multiplier=3, 
    std_upper_multiplier=3
    )

고정 임계값

  • 하한/상한 임계값을 수동 설정
# 고정 임계값
ct = ConstantThreshold(
    lower=0.85, 
    upper=0.95
    )
Python으로 Machine Learning 모니터링

사용자 지정 임계값 지정

# 임계값 메서드 임포트(이전 슬라이드)
from nannyml.thresholds import ConstantThreshold, StandardDeviationThreshold

# 임계값을 CBPE 알고리즘에 전달
estimator = nannyml.CBPE(...
    metrics = ['roc_auc', 'accuracy'],
    thresholds={'roc_auc': ct, 'accuracy' : stdt}
)

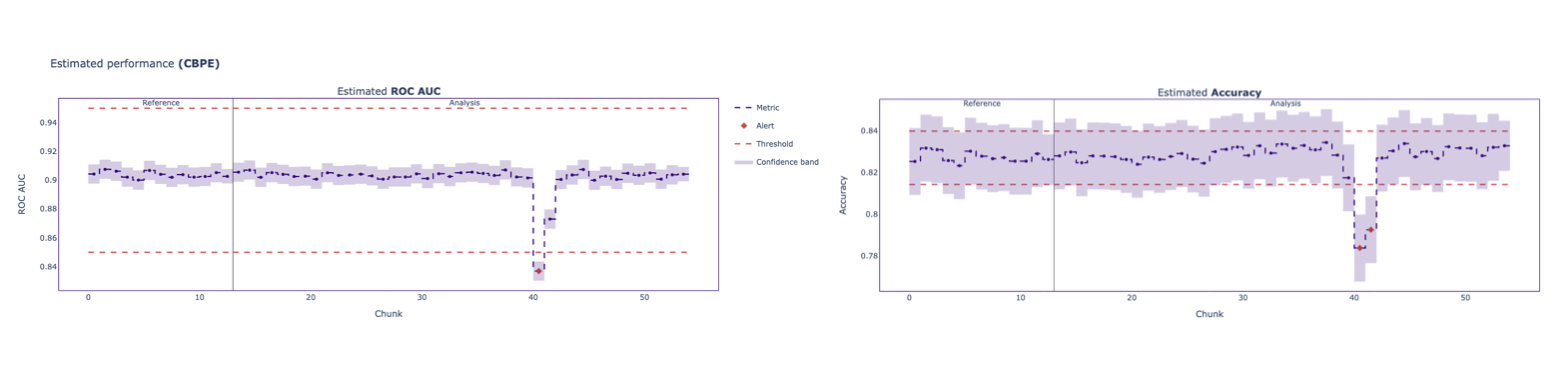
이미지는 ROC AUC와 accuracy 지표의 사용자 지정 임계값을 적용한 추정 성능 플롯을 보여 줍니다.

Python으로 Machine Learning 모니터링

결과 필터링

  • 기간별
    filtered_results = results.filter(period='analysis')
    
  • 지표별

    filtered_results = results.filter(metrics=['mae'])
    
  • 둘 다

    filtered_results = results.filter(period='analysis', metrics=['mae'])
    
Python으로 Machine Learning 모니터링

결과를 데이터프레임으로 내보내기

# 결과를 데이터프레임으로 내보내기
results.filter(period='analysis').to_df()

이미지는 데이터프레임 형식의 결과를 보여 줍니다.

Python으로 Machine Learning 모니터링

Vamos praticar!

Python으로 Machine Learning 모니터링

Preparing Video For Download...