첫 번째 shinydashboard

shinydashboard로 대시보드 만들기

Png Kee Seng

Researcher

지금까지 정리

  • 사용자 인터페이스(UI) 와이어프레이밍
    • 헤더, 사이드바, 본문
  • 출력과 사용자 입력 간 상호작용 정의
  • 이 역할은 server가 담당합니다

drawing

header <- dashboardHeader(...)
sidebar <- dashboardSidebar(...)
body <- dashboardBody(...)

ui <- dashboardPage(header, sidebar, body)
server <- function(input, output) { ... }
shinyApp(ui, server)
shinydashboard로 대시보드 만들기

server

  • 입력과 출력을 정의해야 합니다
  • 출력과 사용자 입력의 상호작용을 지정합니다
  • 헬퍼 함수를 정의하면 지저분함이 줄고 가독성이 좋아집니다
    • 이 헬퍼 함수들은 코드 상단에 둡니다

server는 주방과 소통하는 친절한 웨이터와 같습니다. shinyApp의 server는 입력이 출력과 어떻게 상호작용할지를 R에 알려 줍니다.

shinydashboard로 대시보드 만들기

그래프 추가하기

  • 전역 축구 토너먼트 대시보드로 돌아갑니다
  • 팀 1에 대한 헥스빈 그래프를 추가합니다
  • 그런 다음 이 그래프를 server에 배치합니다
  • 팀 2에도 같은 그래프가 필요하면?
soccer %>%
  ggplot(aes(x=`1_passes_compeletd`, 
             y=`1_goal_prevented`)) +
  geom_hex(bins=10) + theme_classic()
server <- function(input, output){
  output$plot1 <- renderPlot({
  fifa %>%
    ggplot(aes(x=`1_passes_compeletd`, 
               y=`1_goal_prevented`)) +
    geom_hex(bins=10) + theme_classic()
  })
}
shinydashboard로 대시보드 만들기

server에서 ggplot 객체 정의하기

server <- function(input, output) {
  output$plot1 <- renderPlot({
    if (input$team == 1){

fifa %>% ggplot(aes(x=`1_passes_compeletd`, y=`1_goal_prevented`)) + geom_hex(bins=10) + theme_classic()
} else if (input$team == 2){
fifa %>% ggplot(aes(x=`2_passes_compeletd`, y=`2_goal_prevented`)) + geom_hex(bins=10) + theme_classic()
} }) }
shinydashboard로 대시보드 만들기

헬퍼 함수 사용하기

plot_hex <- function(team){
  if (team == 1){
    soccer %>% ggplot(aes(x=`1_passes_compeletd`, 
                        y=`1_goal_prevented`)) +
      geom_hex(bins=10) + theme_classic()
  }
  else if (team == 2){
    soccer %>% ggplot(aes(x=`2_passes_compeletd`, 
                        y=`2_goal_prevented`)) +
      geom_hex(bins=10) + theme_classic()
  }
}
shinydashboard로 대시보드 만들기

헬퍼 함수 사용하기

헬퍼 함수 사용 시

server <- function(input, output) {
  output$plot1 <- renderPlot(plot_hex(input$team)) 
}
  • 더 읽기 쉽지 않습니까?

헬퍼 함수 없이

server <- function(input, output) {
  output$plot1 <- renderPlot({
    if (input$team == 1){
      soccer %>% ggplot(aes(x=`1_passes_compeletd`, 
              y=`1_goal_prevented`)) +
        geom_hex(bins=10) + theme_classic()
      }
    else if (input$team == 2){
      soccer %>% ggplot(aes(x=`2_passes_compeletd`, 
              y=`2_goal_prevented`)) +
        geom_hex(bins=10) + theme_classic()
      }
    })
}
shinydashboard로 대시보드 만들기

모두 합쳐 보기

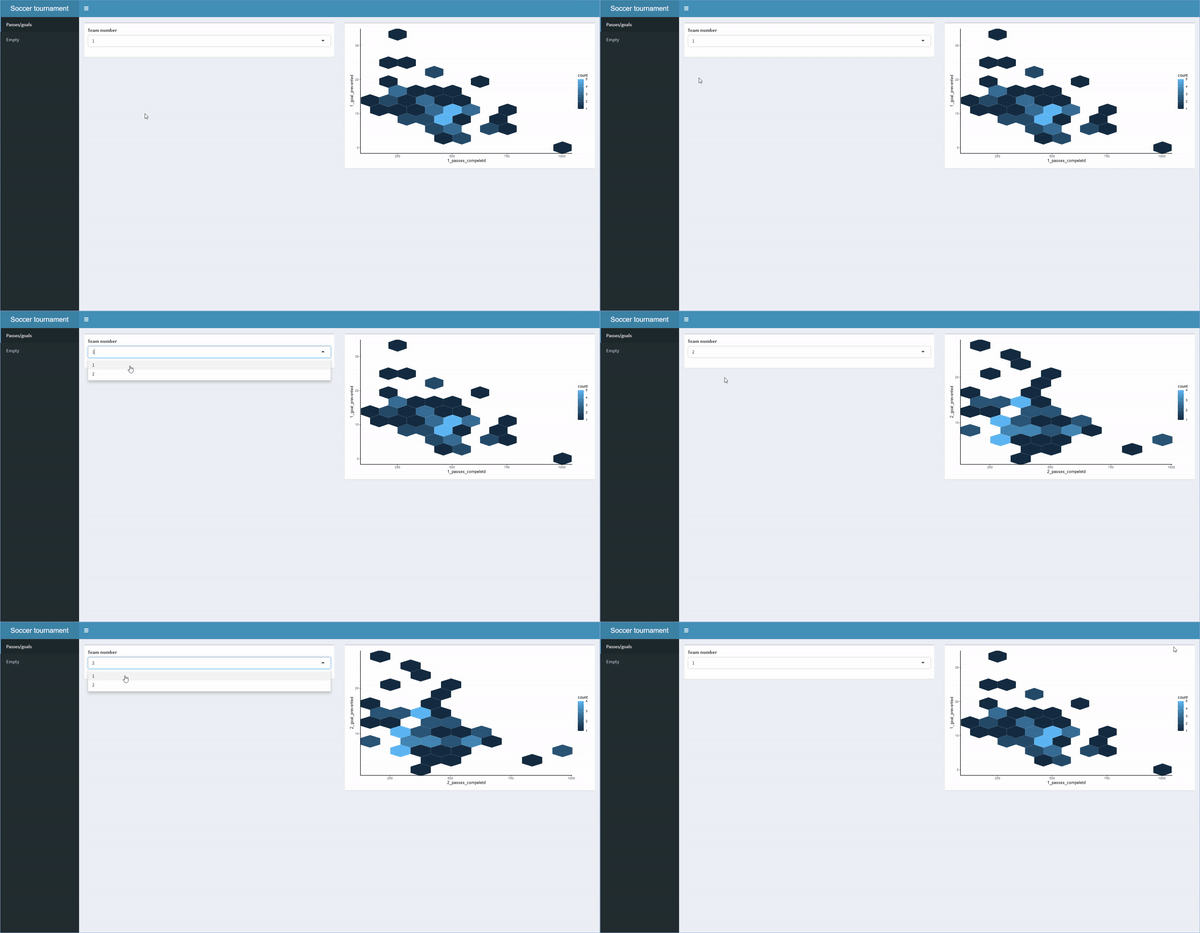
# 완성된 shinydashboard

header <- dashboardHeader(title = "Soccer tournament")
sidebar <- dashboardSidebar(sidebarMenu(menuItem("Passes/goals", tabName = "passtab"), menuItem("Empty", tabName = "emptytab")))
body <- dashboardBody(tabItems( tabItem("passtab", fluidRow(box(selectInput("team", "Team number", choices = c(1,2))), box(plotOutput("plot1"))) ), tabItem("emptytab")) )
ui <- dashboardPage(header, sidebar, body)
server <- function(input, output) { output$plot1 <- renderPlot(plot_hex(input$team)) }
shinyApp(ui, server)
shinydashboard로 대시보드 만들기

렌더링된 shinydashboard의 모습입니다. 사용자가 서로 다른 페이지/탭을 전환하고, 입력을 제공해 다른 출력을 얻을 수 있음을 보여줍니다.

shinydashboard로 대시보드 만들기

연습해 봅시다!

shinydashboard로 대시보드 만들기

Preparing Video For Download...