본문

shinydashboard로 대시보드 만들기

Png Kee Seng

Researcher

개요

  • shinydashboard UI의 대부분을 차지합니다
  • 보통 입력과 출력을 여기에 둡니다
    • 식당의 메뉴와 주문과 비슷합니다
    • 서버가 둘의 소통을 돕습니다
  • 본문은 dashboardBody()로 정의하고 관례적으로 body에 저장합니다
body <- dashboardBody(...)
shinydashboard로 대시보드 만들기

와이어프레이밍

  • 와이어프레임 설계 수행
    • 내용을 넣기 전에 구조를 잡습니다
  • shinydashboard에서는 먼저 객체의 위치를 정합니다

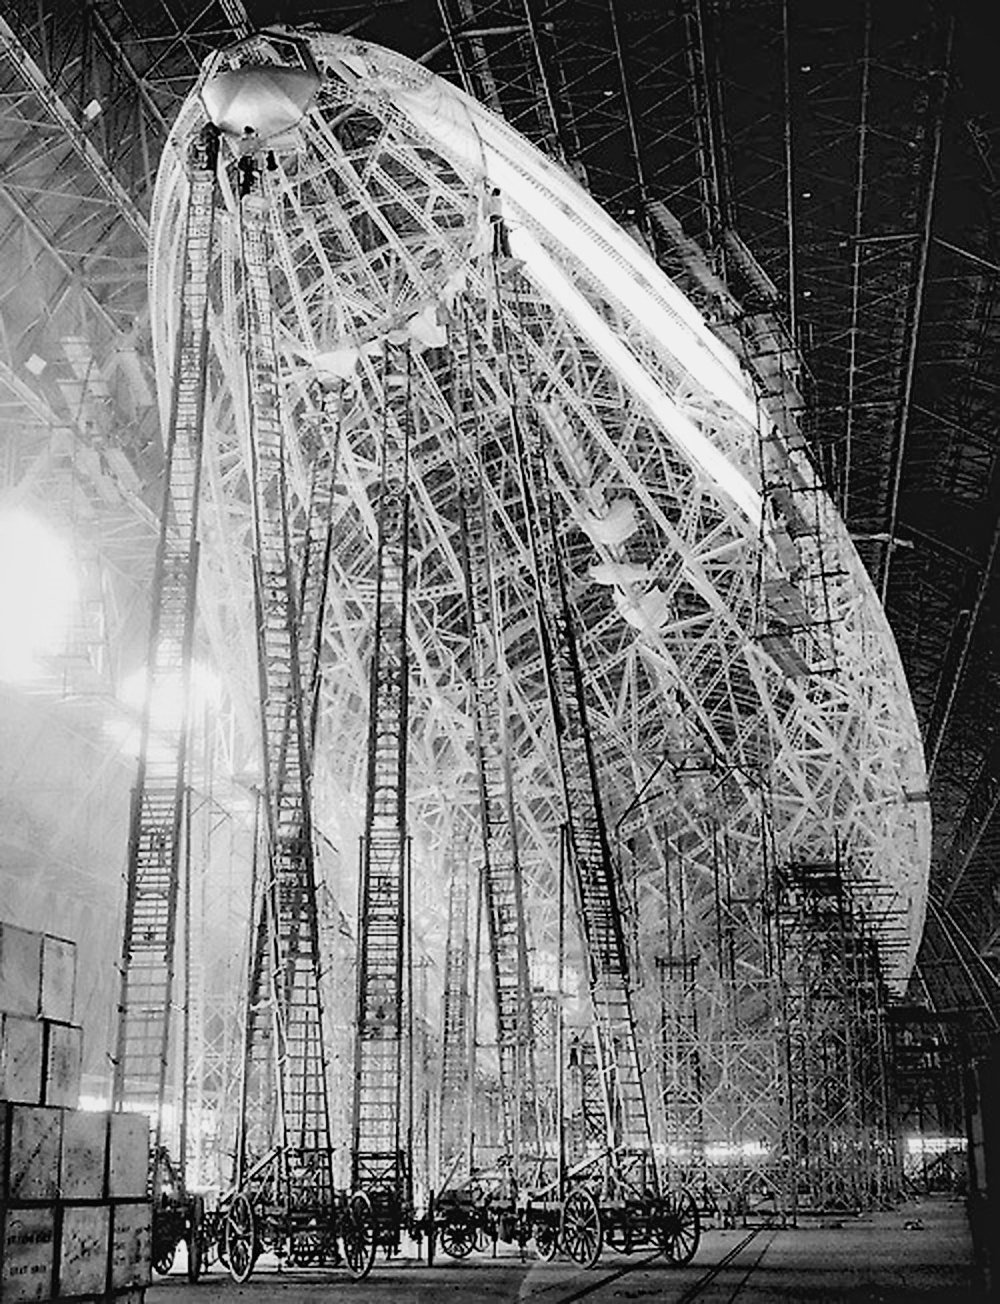
비행선의 와이어프레임.

1 Brett Jordan, Flickr
shinydashboard로 대시보드 만들기

행과 상자 추가: 빈 상자

  • fluidRow()로 행을 추가합니다
  • box()로 상자를 추가합니다

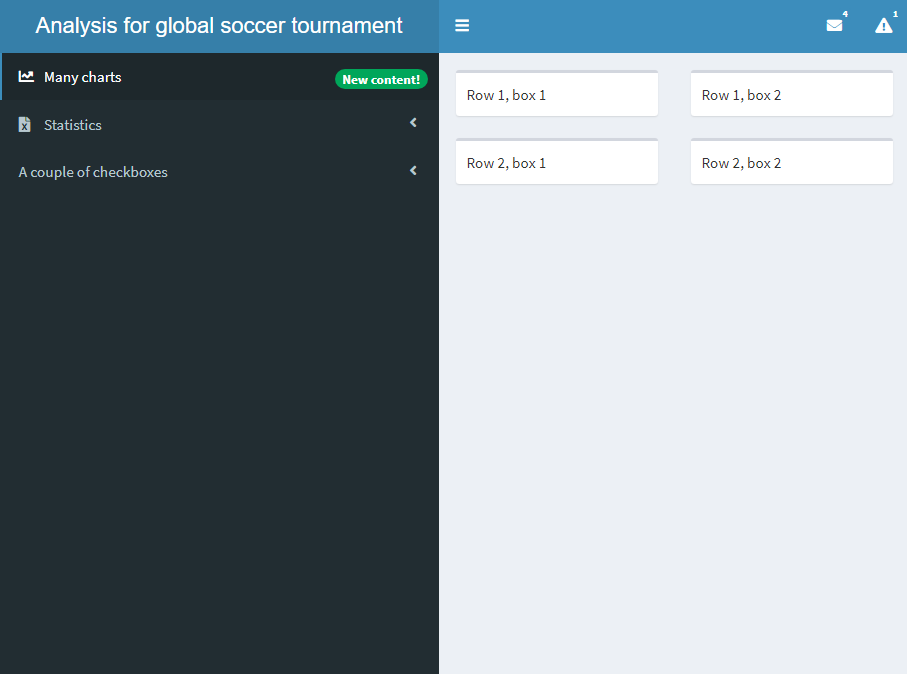
두 행에 각 두 개의 빈 상자가 있는 대시보드.

body <- dashboardBody(

fluidRow(
box("Row 1, box 1"), box("Row 1, box 2")
), fluidRow(
box("Row 2, box 1"), box("Row 2, box 2")
)
)
shinydashboard로 대시보드 만들기

행과 상자 추가: 상자 안의 콘텐츠

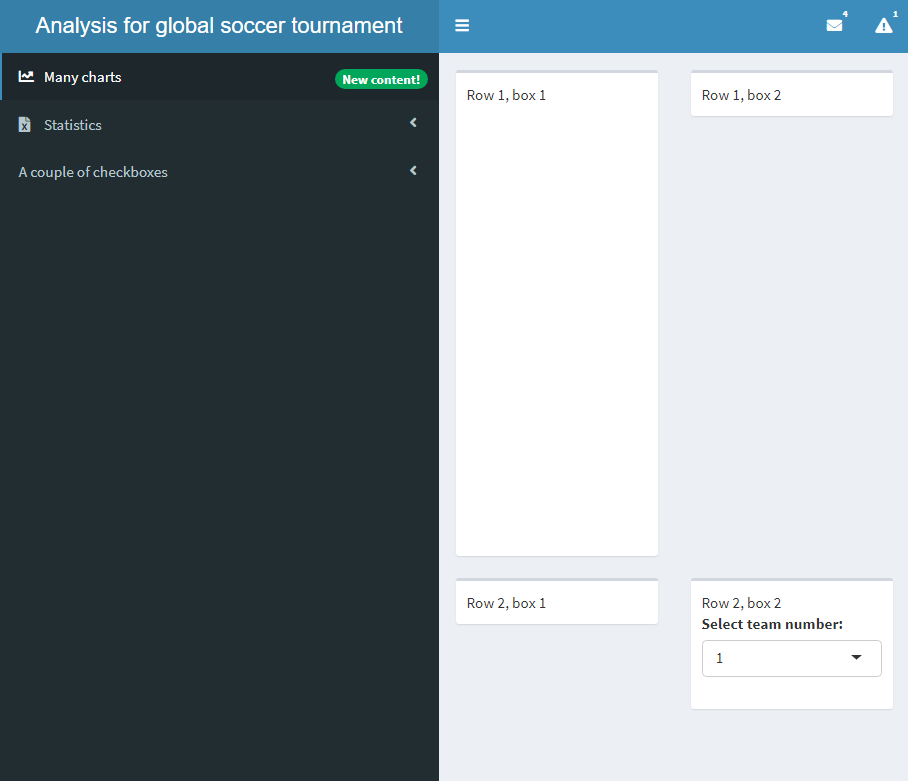
일부 상자에 내용이 있는 네 개 상자의 본문.

body <- dashboardBody(
  fluidRow(box("Row 1, box 1", 

plotOutput('plot')),
box("Row 1, box 2")), fluidRow(box("Row 2, box 1"), box("Row 2, box 2",
selectInput("select", "Select team number:", choices = c(1,2))))
)
shinydashboard로 대시보드 만들기

상자 넘침 방지

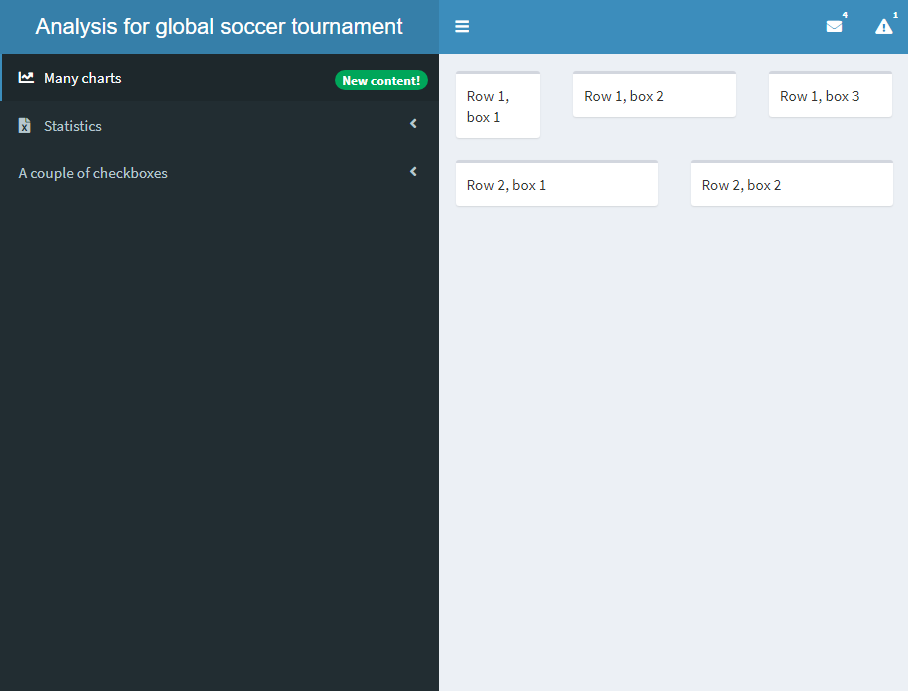
  • 기본적으로 각 상자는 가로 공간 12단위 중 6단위를 차지합니다
  • 넘침을 막으려면 width를 설정합니다
    • 예시에서는 3, 5, 4로 설정
  • box() 추가를 권장합니다

본문의 더 많은 상자

body <- dashboardBody(
  fluidRow(box("Row 1, box 1"), 
           box("Row 1, box 2"),
           box("Row 1, box 3")),
  fluidRow(box("Row 2, box 1"), 
           box("Row 2, box 2"))
)
body <- dashboardBody(
  fluidRow(box("Row 1, box 1", width = 3), 
           box("Row 1, box 2", width = 5),
           box("Row 1, box 3", width = 4)),
  fluidRow(box("Row 2, box 1"), 
           box("Row 2, box 2"))
)
shinydashboard로 대시보드 만들기

valueBox와 infoBox

  • 소량 정보를 표시하는 상자도 있습니다
    • valueBox()
    • infoBox()

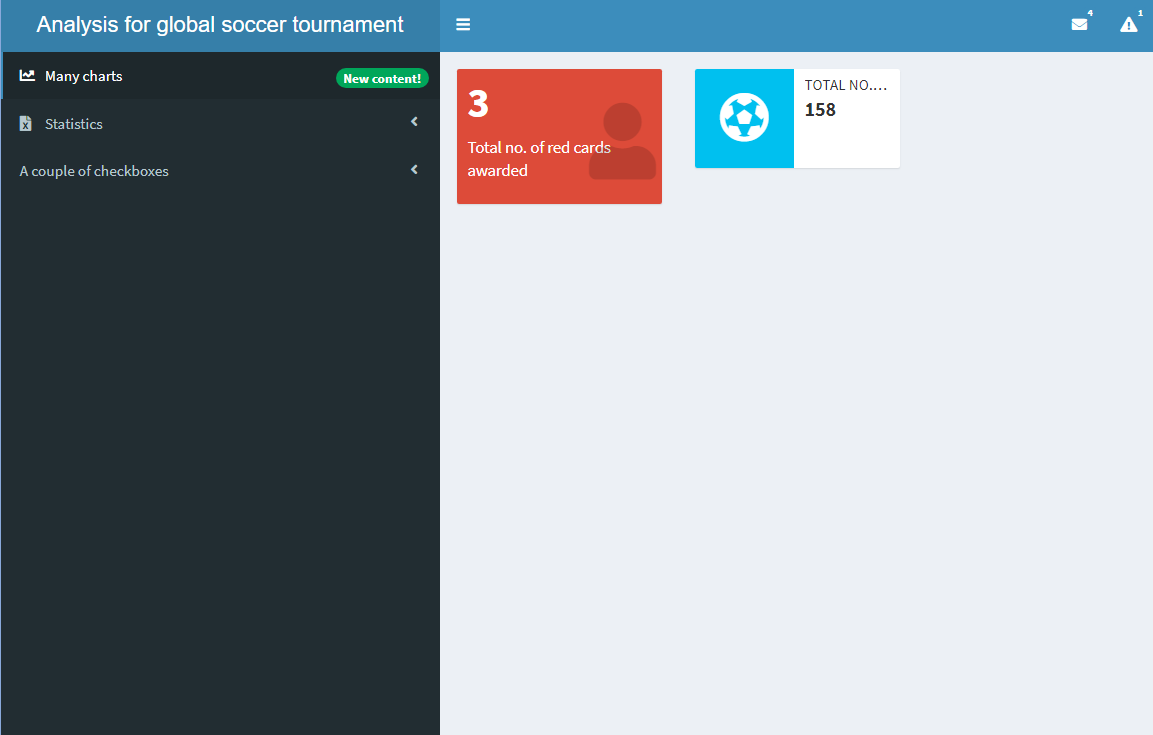
본문의 valueBox와 infoBox.

body <- dashboardBody(
  fluidRow(valueBox(value = 3, 
                    subtitle = "Total no. of red cards awarded", 
                    icon = icon("user"),
                    color = "red"),

infoBox(value = 158, title = "Total no. of goals scored", icon = icon("futbol")) ))
shinydashboard로 대시보드 만들기

valueBoxOutput과 infoBoxOutput

  • valueBox()와 infoBox()의 변형: valueBoxOutput() 및 infoBoxOutput()
  • 이는 출력 함수입니다
  • renderValueBox()와 renderInfoBox()도 있습니다
  • valueBox()와 infoBox()가 필요합니다

본문의 valueBoxOutput과 infoBoxOutput. 렌더링 결과는 이전과 동일합니다.

body <- dashboardBody(
  fluidRow(valueBoxOutput(outputId = "valuebox1"),
           infoBoxOutput(outputId = "infobox1")
           ))
server <- function(input, output){
  output$valuebox1 <- renderValueBox(
    valueBox(3, "Total no. of red cards awarded",
                icon = icon("user"), color = "red"))
  output$infobox1 <- renderInfoBox(
    infoBox(158, 
                   title = "Total no. of goals scored", 
                   icon = icon("futbol")))
}
shinydashboard로 대시보드 만들기

valueBoxOutput과 plotOutput의 유사성

  • plotOutput():
    • UI에 배치
    • shinydashboard에서 위치를 결정
  • renderPlot():
    • server()에 배치
    • ggplot() 객체 포함
  • valueBoxOutput():
    • UI에 배치
    • shinydashboard에서 위치를 결정
  • renderValueBox():
    • server()에 배치
    • valueBox() 객체 포함
shinydashboard로 대시보드 만들기

사이드바와 본문 연결

  • 앞서 사이드바에 "charts"와 "statistics" 두 버튼이 있었습니다
  • 이를 본문에 연결하려면 tabItems()를 추가해야 합니다
    • 각 페이지는 tabItem()으로 정의
    • 각 menuItem()-tabItem() 쌍의 라벨이 일치해야 합니다

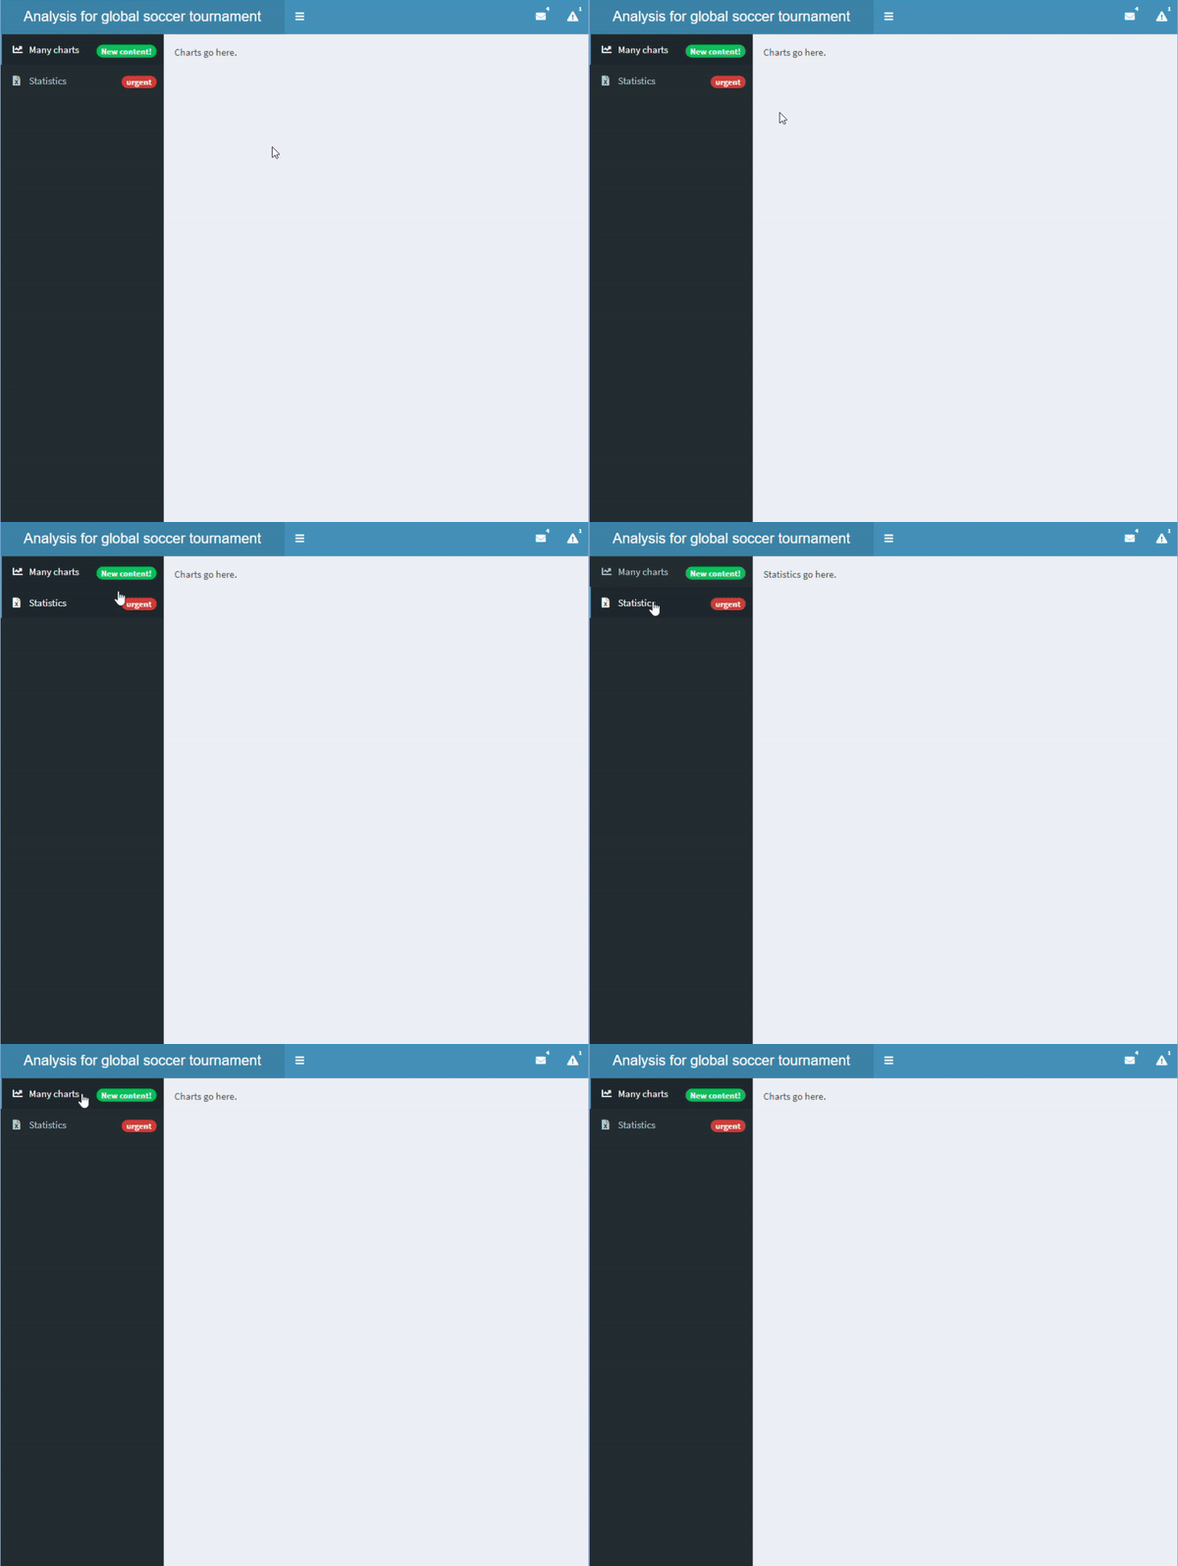
본문과 사이드바가 연결됨

sidebar <- dashboardSidebar(
  sidebarMenu(
    id = "pages",

menuItem("Many charts", tabName = "charts", icon = icon("chart-line"), badgeLabel = "New content!", badgeColor = "green"),
menuItem("Statistics", icon = icon("file-excel"), tabName = "statistics", badgeLabel = "urgent", badgeColor = "red") ))
body <- dashboardBody( tabItems(
tabItem("charts", "Charts go here." ), tabItem("statistics", "Statistics go here." )))
shinydashboard로 대시보드 만들기

본문의 탭

  • shinyApp에서는 tabsetPanel()로 탭 세트를 정의할 수도 있습니다
    • 각 탭은 tabPanel()로 정의
  • tabItems()와 tabItem()과 혼동하지 마십시오

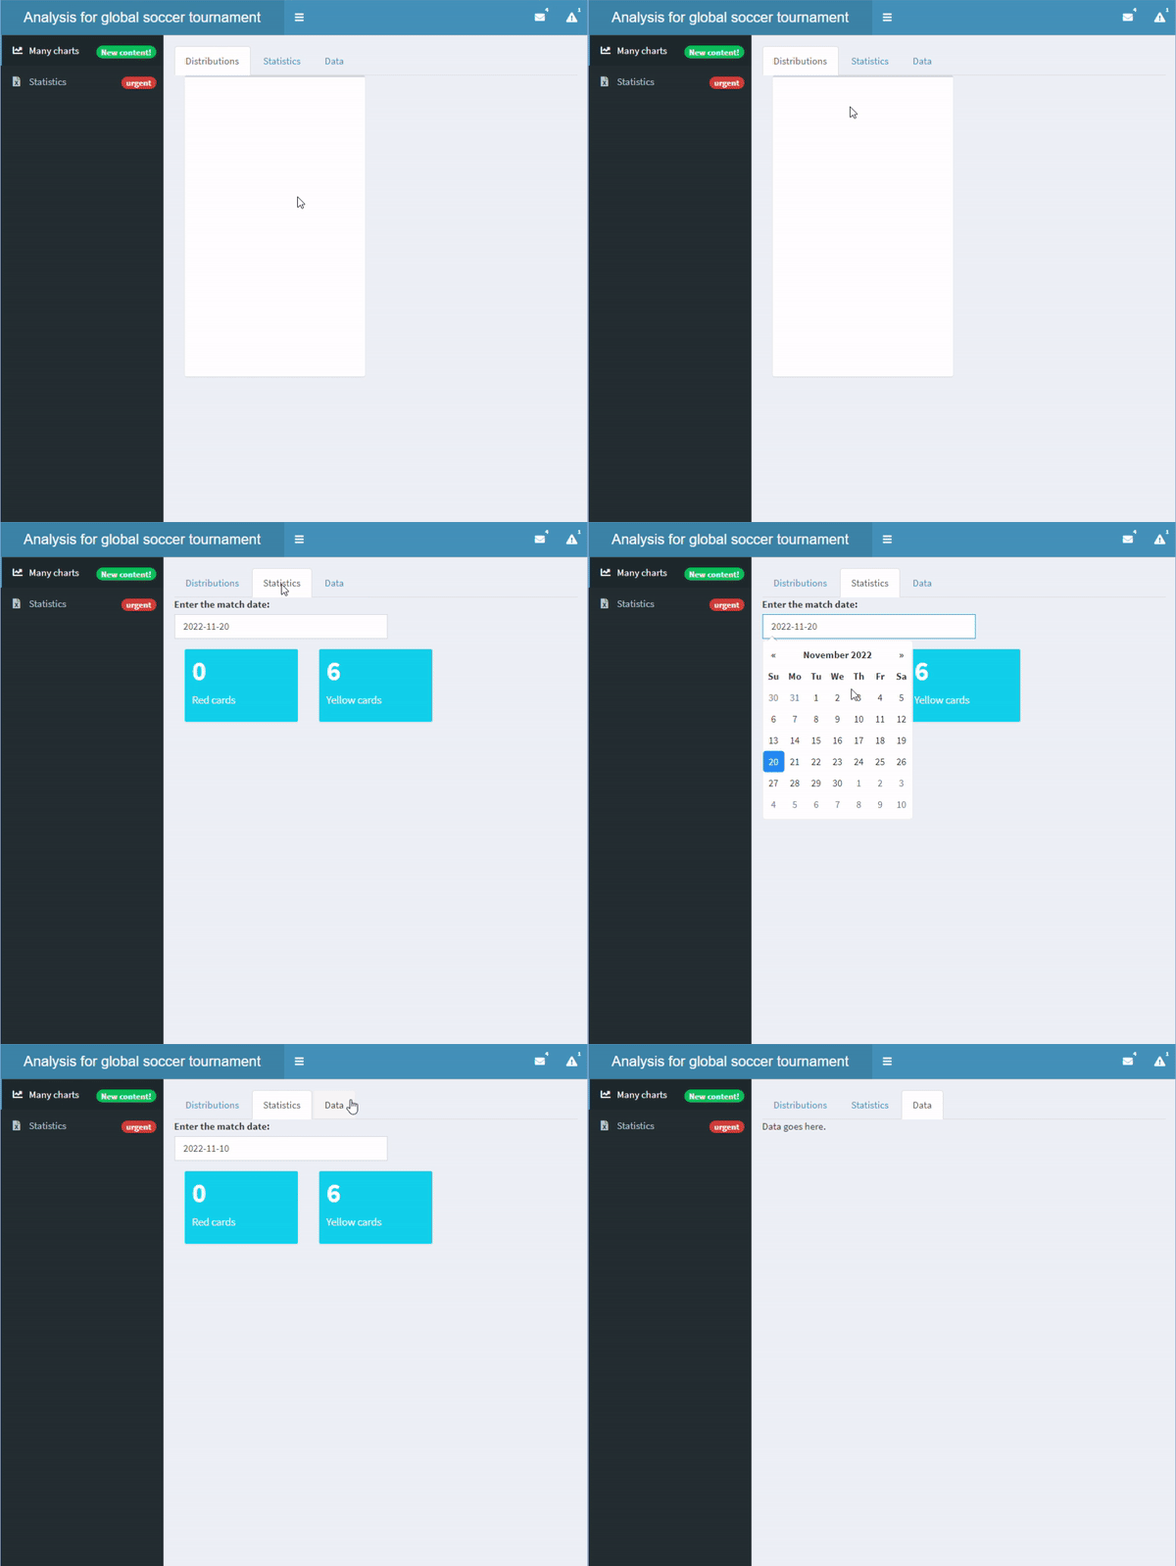
본문에 탭세트 추가

body <- dashboardBody(tabsetPanel(

tabPanel("Distributions", box(plotOutput("dist"))), tabPanel("Statistics", dateInput("matchdate", "Enter the match date:", value = "2022-11-20"), valueBoxOutput("red"), valueBoxOutput("yellow")), tabPanel("Data", "Data goes here.", tableOutput("data"))
))
server <- function(input, output){ output$red <- renderValueBox(valueBox(0, "Red cards")) output$yellow <- renderValueBox(valueBox(6, "Yellow cards")) }
shinydashboard로 대시보드 만들기

연습해 봅시다!

shinydashboard로 대시보드 만들기

Preparing Video For Download...