그룹 간 차이 검정

HR Analytics: R로 살펴보는 직원 데이터

Ben Teusch

HR Analytics Consultant

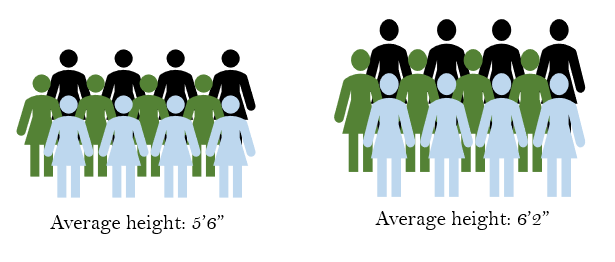
두 그룹 비교

HR Analytics: R로 살펴보는 직원 데이터

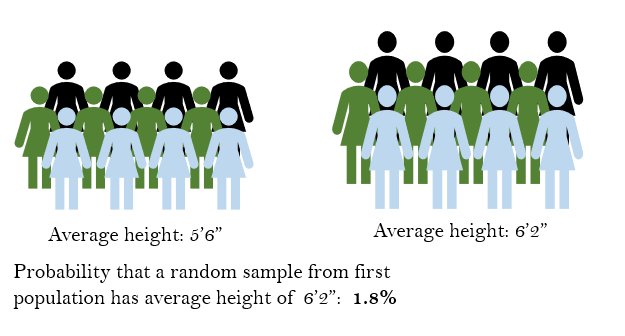
가능성 수치화

HR Analytics: R로 살펴보는 직원 데이터

t-검정

  • 비교 변수가 연속형일 때 사용
t.test(tenure ~ is_manager, data = survey)
    Welch Two Sample t-test

data:  tenure by is_manager
t = -1.2158, df = 834.19, p-value = 0.2244
alternative hypothesis: true difference in means is not equal to 0
95 percent confidence interval:
 -0.34197615  0.08037243
sample estimates:
mean in group Non-manager mean in group Manager 
                 7.376555            7.507357
HR Analytics: R로 살펴보는 직원 데이터

카이제곱 검정

  • 비교 변수가 범주형일 때 사용
chisq.test(survey$left_company, survey$is_manager)
    Pearson's Chi-squared test with Yates' continuity correction

data:  survey$left_company and survey$is_manager
X-squared = 26.275, df = 1, p-value = 1.97e-06
HR Analytics: R로 살펴보는 직원 데이터

공식은 어디에 있나요?

HR Analytics: R로 살펴보는 직원 데이터

연습해 봅시다!

HR Analytics: R로 살펴보는 직원 데이터

Preparing Video For Download...