Python에서 시각화 작동 원리
스프레드시트 사용자를 위한 Python

Chris Cardillo
Data Scientist
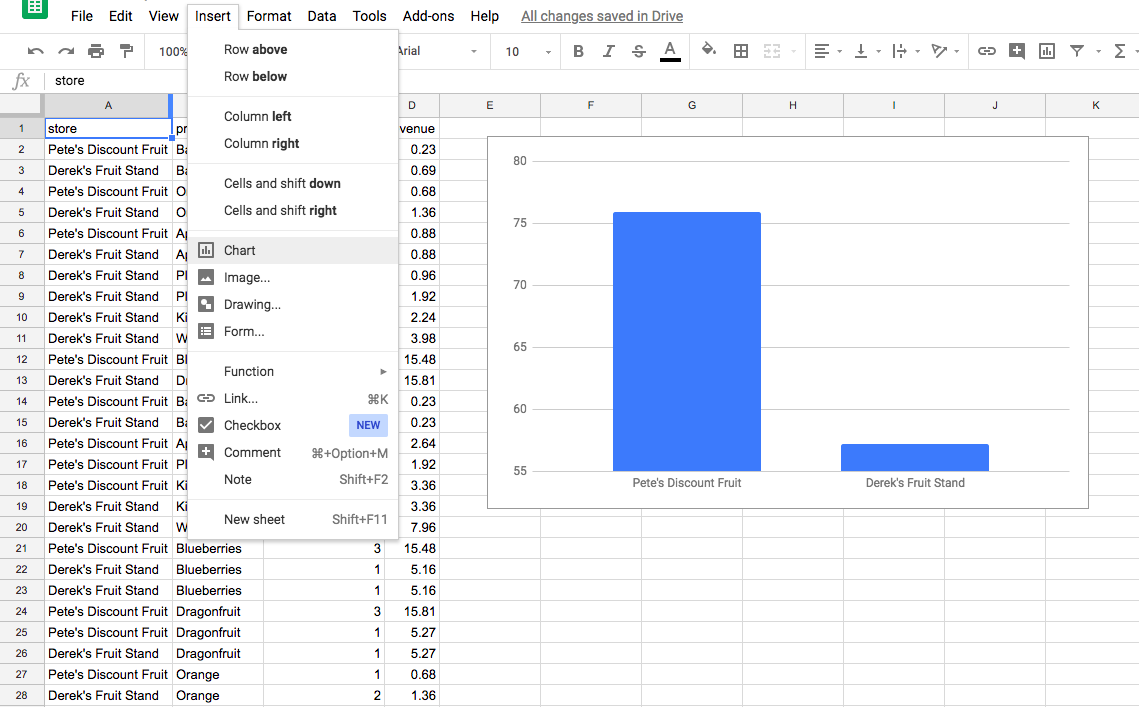
스프레드시트 그래프
Python 그래프
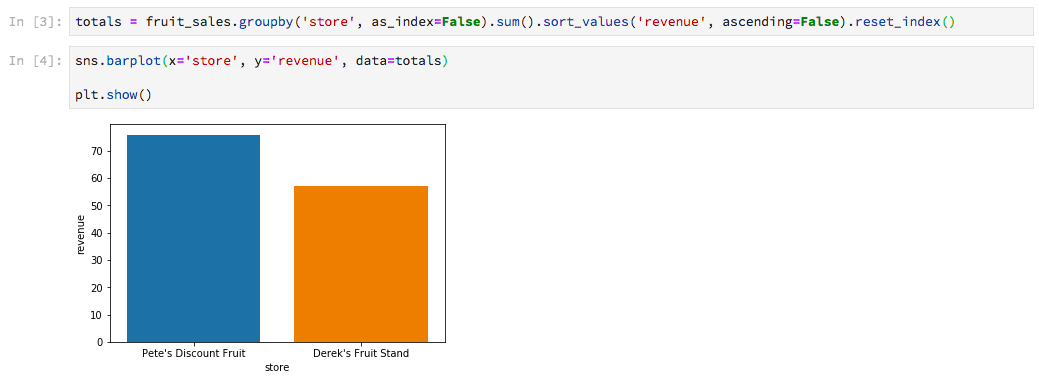
plt.show()
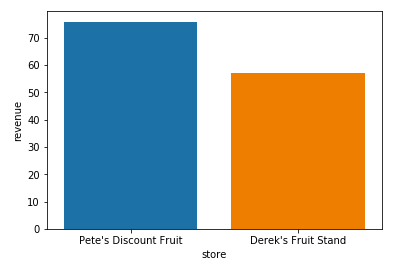
sns.barplot(x='store', y='revenue', data=totals)

plt.show()
스프레드시트 사용자를 위한 Python
Chris Cardillo
Data Scientist
sns.barplot(x='store', y='revenue', data=totals)
plt.show()

